
By: Eric Parker

Eric Parker lives in Seattle and has been teaching Tableau and Alteryx since 2014. He's helped thousands of students solve their most pressing problems. If you have a question, feel free to reach out to him directly via email.
After doing an initial Design Sprint, we dig into most of our projects by hosting a whiteboard session. For more details about how to create a great environment for a successful whiteboard session, check out Kirk’s blog post from last week here.
After setting up a conducive environment, there are several elements to consider for inclusion in your whiteboard to make your development as straightforward as possible.
Leading with a Question
In all our dashboards we focus on leading with a question. It isn’t too different from a problem statement.
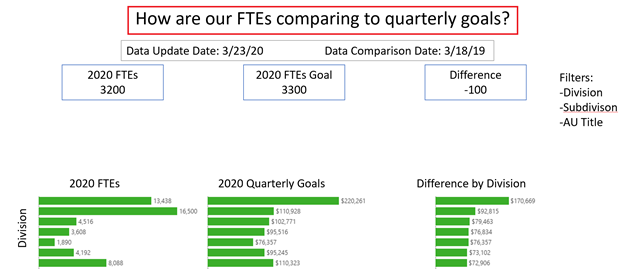
The idea with the question is to focus the audience on the task the dashboard is designed to solve. It is easy to get distracted by other interesting tangents. Leading with a question will help you to prioritize the project at hand.
Ideas List
Before trying to come up with ‘perfect’ visuals, I like to get all ideas being considered for inclusion into a list. This helps everyone feel heard and provides a great pool to begin crafting some initial visual ideas in your mind.
For instance, sometimes I will say, “If we can only keep four of these ideas, which are the most important?”.

Layout
Next, it’s important to figure out the general flow and layout of the dashboard. For instance, if you are drilling into geography it could be helpful to start with some summary level, regional info at the top of the dashboard and then have the dashboard drill into further detail (e.g. State, Zip Code) as you get closer to the bottom.
Visuals
Once you’ve set the stage for the purpose of the dashboard, most important ideas to include and general layout, you can start working on visuals!
Make sure you have an eraser handy. This step includes a lot of trial and error.
The visuals that make the most appearances in my dashboards include:
● Bar Charts
● Highlight Tables
● Line Graphs

Sometimes it’s fun to get fancy and include things like donut charts and 100% of Total Stacked Bars. The most important factor in choosing the ‘right’ visuals is knowing your audience. If they are advanced data consumers, feel free to experiment with unconventional visuals! If they aren’t going to look at the dashboard for more than 15 seconds in a single setting, keep it simple.
For inspiration, here are a few resources you might find helpful:
● Visual Vocabulary - Andy Kriebel
● Tableau Chart Catalog - Kevin Flerlage
Tooltips
Usually, it’s not possible to fit all the concepts from your “Ideas List” into the visual component of your dashboard.
If they just don’t fit your options include:
● Leaving them out entirely
● Putting them in another dashboard
● Adding them to a tooltip
Tooltips, as you know, are a great way of packing more information into your dashboard without visually overwhelming users.

Filters List
I also find it nice to know up front what values people will want to filter on. I encourage stakeholders in the design meeting to be as thorough as possible. All dates, business units, geographies and identifiers are on the table. Trying to figure out where to cram filters into a finished dashboard is annoying. It’s better to know what you need to include up front!

Layering for Detail
In many projects, it’s not possible for all the ideas and levels of necessary detail to fit into a single dashboard. This is where having a large whiteboard is helpful! You can whiteboard several dashboards at once and use arrows to demonstrate where they can interact with and navigate to each other. Think of each dashboard as a “chapter” in your data storytelling book.
Do you have any other steps you like to routinely include? Let us know in the comments below!
Need help with your own whiteboard session? Reach out to us directly or sign up for an office hour. We would love to help!