
I frequently hear the question, “Can Tableau show my missing data?”. Generally when I get this question, people want to either see a 0 or a blank where there should be missing data.
Let’s go through an example.
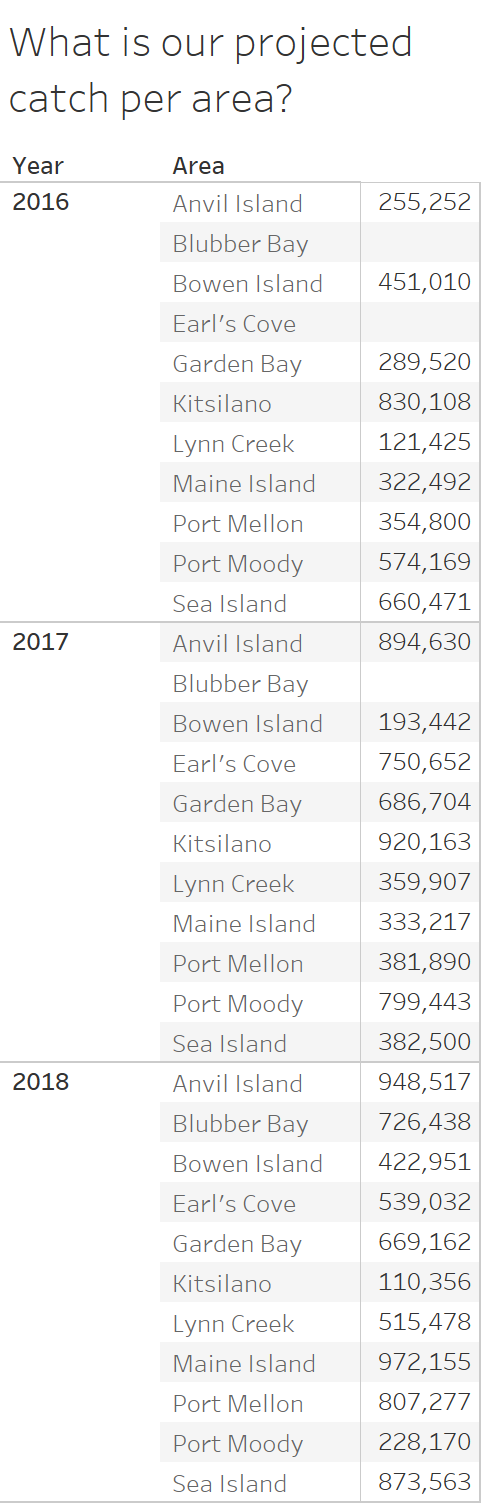
You work for a seafood company. You want to project how much fish you intend to catch in each of your marine areas.
Your data looks like this:

As the years go on, the company grows and includes more marine areas.

In 2017 the company started to fish Earl’s Cove and in 2018 they began operations in Blubber Bay.
When the data is displayed in a table (like above) those areas still show for all years, just as blanks. Unfortunately, there is no way to show those cells as 0s. Tableau is great at visualizing existing data but is not designed to create new data.
Even more difficult are scenarios like this:

When the data is pivoted like this, there isn’t even a blank row for Earl’s Cove or Blubber Bay in 2016.
What can you do?
This is a problem Tableau Prep can help solve. Buckle up because we’re going to jump through some complex steps here.
You can start by pulling the data into Tableau Prep and using an aggregate step to get a unique list of each year and area.

Note the additional step of turning year into a string field. This is important for the next step.
After getting a unique list of each dimension (and ensuring they are the same data type) I’m going to create a cross join where the Area and Year fields don’t match.
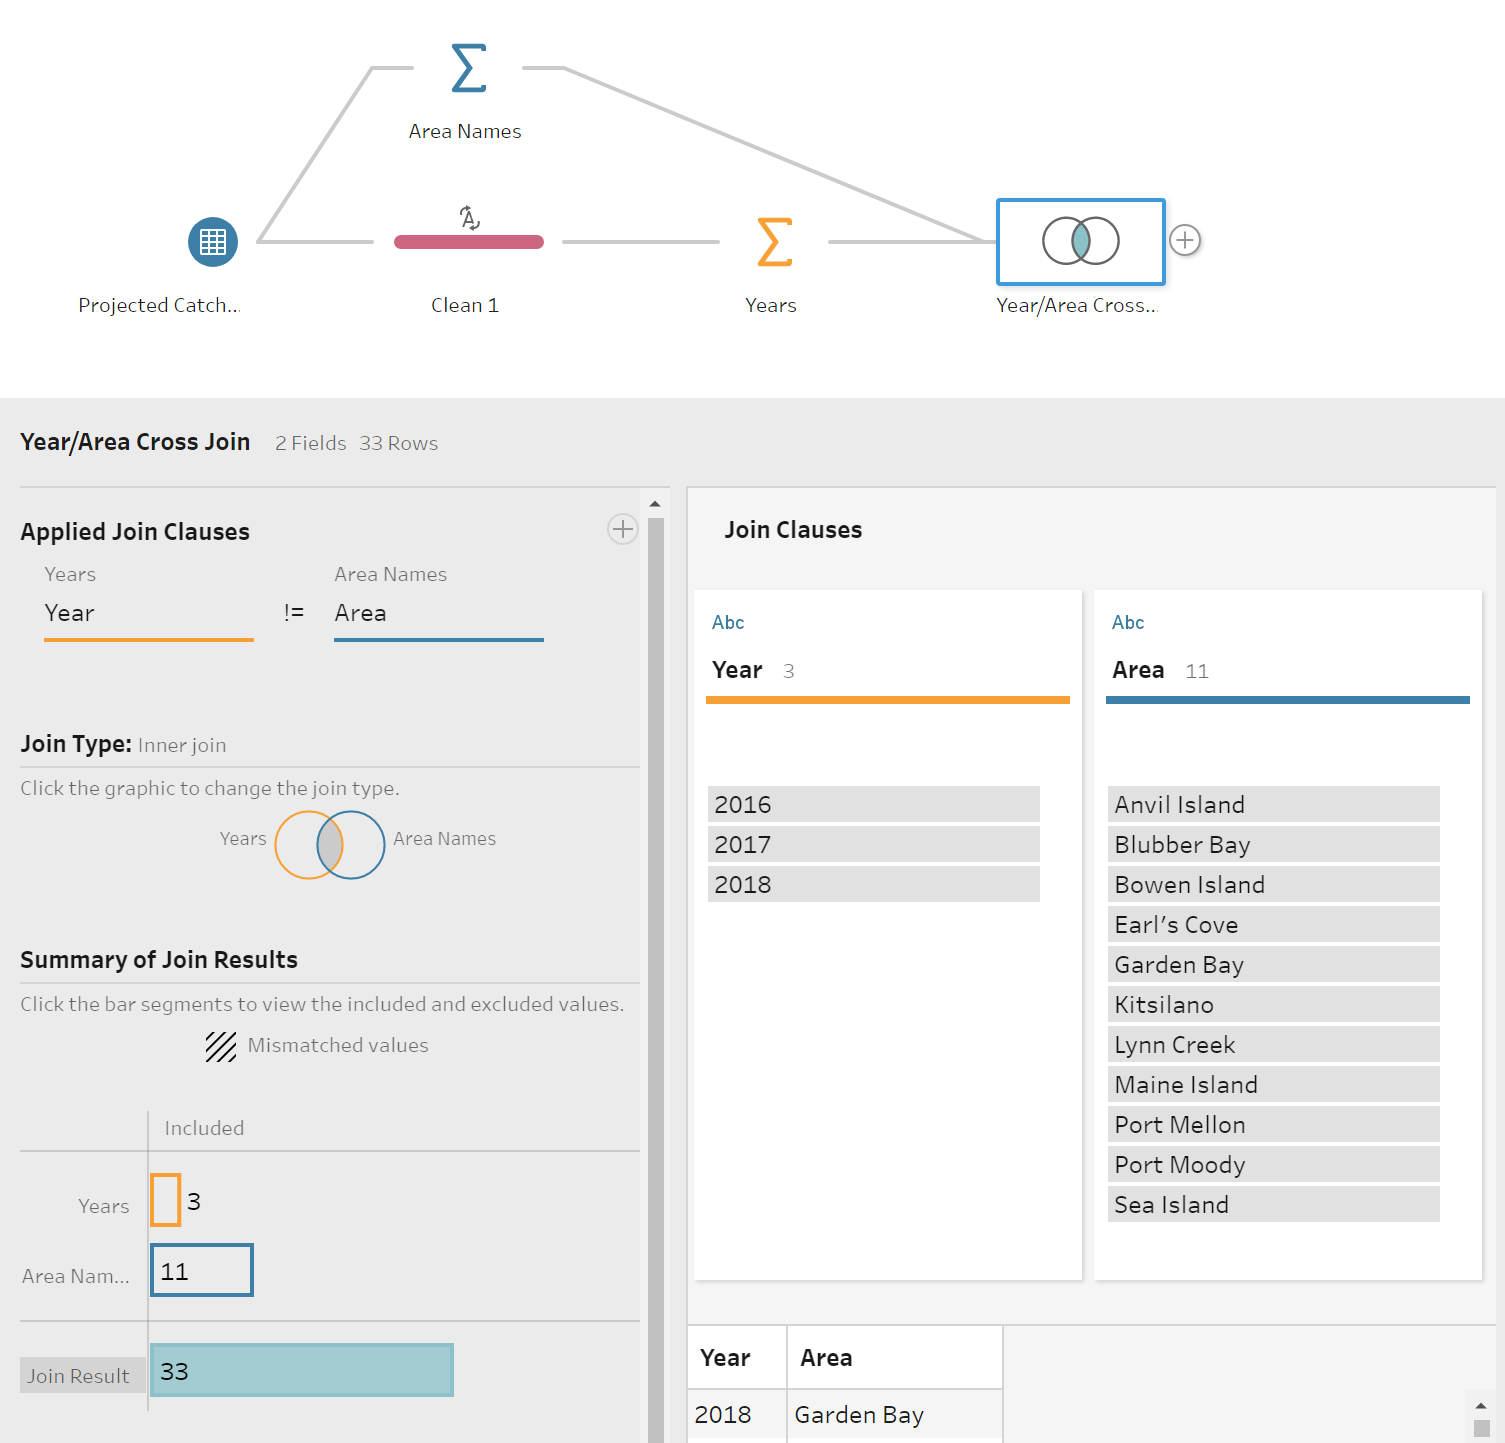
The result is that I’ll get a row of data for each combination of Year and Area.
Next, we’ll join the original data to the cross join data on Year = Year and Area = Area and only keep the records that don’t match from the cross join data.

After adding a clean step to remove duplicate fields from the join, we can union the original data to the generated data.

After generating an output, we can see the results in Tableau Desktop.
We can even use the ZN() function to replace those blanks with 0s.

Need help generating your own missing data? Sign up for an office hour and we’ll tackle it together!