
By: Eric Parker

Eric Parker lives in Seattle and has been teaching Tableau and Alteryx since 2014. He's helped thousands of students solve their most pressing problems. If you have a question, feel free to reach out to him directly via email.
Need help with your Tableau calculations? Sign up for an office hour to work with Eric! Want to dive deep into Tableau? Check out our upcoming Tableau classes!
--
If you are coming to Tableau from Excel you are probably familiar with nested if statements. Nested IF statements occur when you have multiple criteria that need to be satisfied to return a certain output. Tableau’s if statements are a little different than other tools.
Imagine I’m analyzing my business and would like to break down each segment on two values:
● Large Segment (100+ orders) or Not.
● Profitable or Not.
The result may look something like this:

First, I’ll create the structure of the worksheet by using Superstore data and putting Segment on Columns and Sub-Category on Rows.

Next, I’ll create the calculation with the nested IF statements.
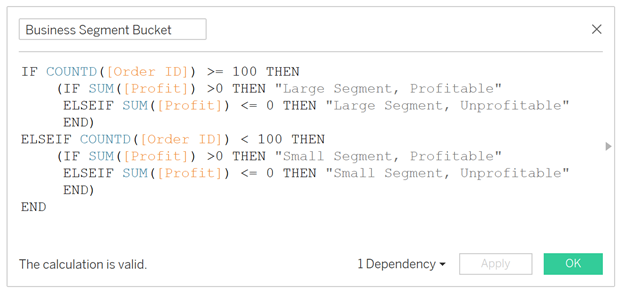
Notice there are essentially 3 total IF statements in this calculation.
1. The overall IF statement which determines if the segment has more or less than 100 orders.
2. The IF statement which breaks the large orders into Profitable and Unprofitable buckets.
3. The IF statement which breaks the small orders into Profitable and Unprofitable buckets.
A few tricks and things to look out for:
● Each IF statement needs its own END. I have 3 END lines because I have 3 IF statements.
● I prefer to tab secondary IF statements. It’s hard to look at and follow the logic of several if statements if they all start and end at the same indentation level.
● The parenthesis around my secondary IF statements aren’t required but are a helpful visual break and ensure that none of the logic from those statements accidentally runs into the overall IF statement.
Also, notice that every field reference ([Order ID] and [Profit]) is aggregated. You cannot have some fields aggregated and others not aggregated. If you get an error like “Cannot mix aggregate and non-aggregate comparisons or results in ‘IF’ expressions” check out this blog post to learn what the issue is and how to solve it.
Now to create the visual from the beginning of the post.
If I simply drop the calculation on Color in the Marks card, I end up with little squares that don’t expand to fill the entire cell.

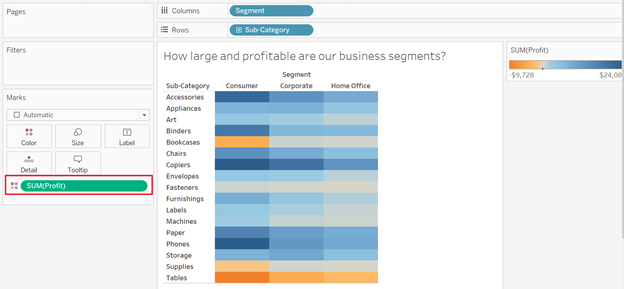
You may have noticed this issue before. The problem is that the [Business Segment Bucket] calculation is discrete (blue pill). When your mark type is “Square” and you drop continuous fields on the Color tab in the Marks card, those squares expand into cells that interlock nicely together.
For example, notice how this looks when Profit is dropped on Color in the Marks card.
The workaround is to set the Mark type to “Bar” and put MIN([Number of Records]) on Size in the Marks card.

You may need to make some adjustments to the size slider inthe Size tab or add borders (done from the Color tab) but now you have a nice looking highlight table and no one can tell that they are technically bars!
Need help working through your own Tableau questions? Sign up for an Office Hour to supercharge your project!