
By: Eric Parker

Eric Parker lives in Seattle and has been teaching Tableau and Alteryx since 2014. He's helped thousands of students solve their most pressing problems. If you have a question, feel free to reach out to him directly via email.
If you use Tableau and work for a public facing agency, it’s likely you need to create some content that is available for public consumption. In many circumstances, it’s unlawful to display data for sample sizes below a certain headcount.
For instance, imagine you work for a public university and want to understand educational outcomes for students based on their race/ethnicity. If the race/ethnicity you are displaying data for has less than 10 people, you’d like to filter it out of the view.
Here’s what the (completely fake) sample data I will be working with looks like.

Here is a breakdown of student count by race/ethnicity.

Given the above counts, Native American and Alaska Native should be removed from the view.
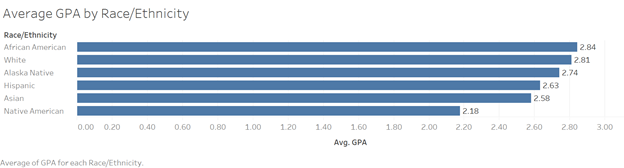
So let’s say our view where we are analyzing average GPA by group looks like this.
One quick way to filter the small populations out would be to write a calculation like this:

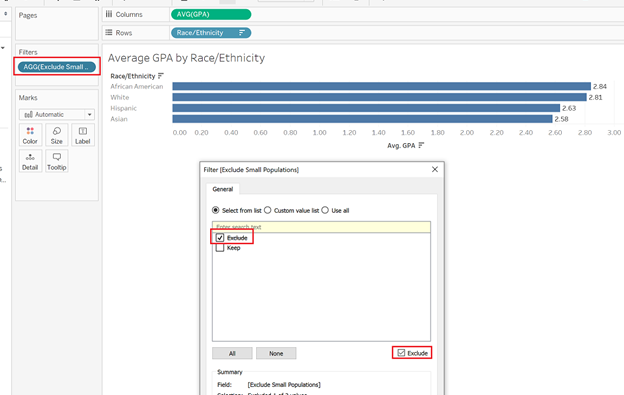
By putting that calculation on the Filters card and excluding the “Exclude” section we can ensure we are only keeping the data for larger populations.
Here’s a caveat however, if you are showing any form of totals, that data is now entirely removed from the worksheet and the totals will be affected. For example, let’s say you were trying to compare each ethnicity to the overall average. I’ll add a total bar at the bottom.

Before filtering the average GPA of a student is 2.70.

After filtering it’s 2.73.

One way you can retain the correct 2.70 figure without displaying small populations is to hide the data. In this case I’ll put the [Exclude Small Populations] field on the Rows shelf and hide the “Exclude” section.

Then, you can select the dropdown on the [Exclude Small Populations] field on rows and deselect “Show Header” to hide that field entirely.

Now, only the race/ethnicity groups with qualifying population sizes are displaying but the overall figure still represents the entire population.

Need help working through your own Tableau questions? Sign up for a Tableau Office Hour to supercharge your project!