
By: Eric Parker

Eric Parker lives in Seattle and has been teaching Tableau and Alteryx for 5 years. He's helped thousands of students solve their most pressing problems. If you have a question, feel free to reach out to him directly via email.
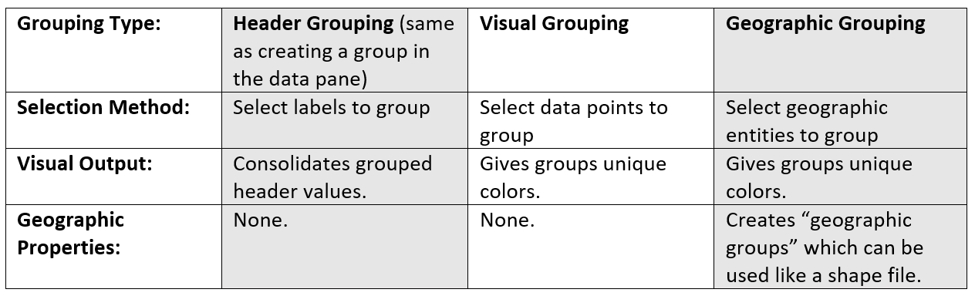
There are three distinct methods for creating groups in Tableau. The differences and features of the differences aren’t well understood. We’ll take the time to review those three methods throughout this post. Those three methods are; header grouping, visual grouping and geographic grouping. See the below table for a quick reference.
Header Grouping
Header grouping allows users to consolidate header values. Consider the following bar chart.
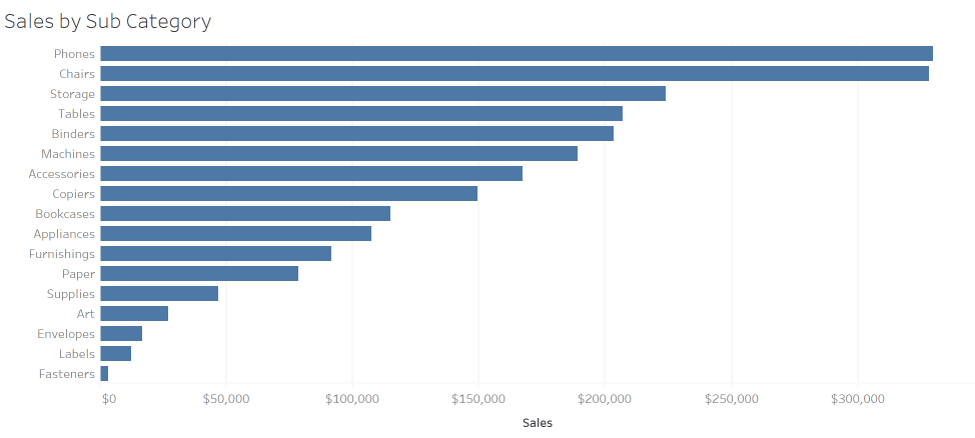
If you want to consolidate the last several, small values into a single bar you can (Shift +) select the labels (not the bars) and choose the group icon.
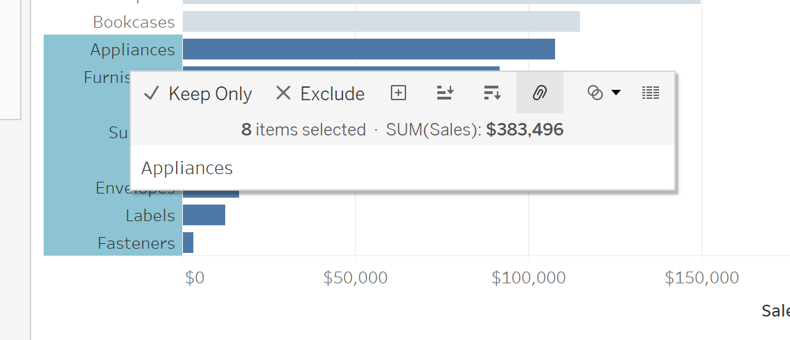
The output is that those selected values become consolidated into a single value.

By right-clicking on that value, you can rename the group by editing the alias.
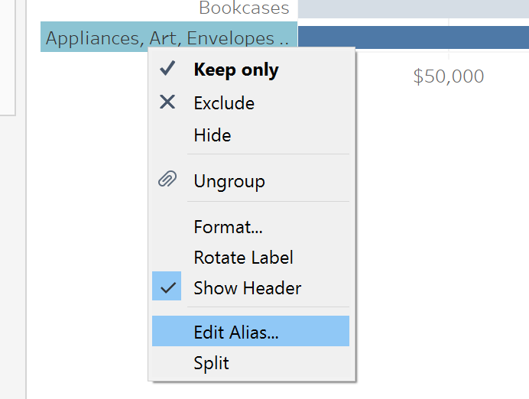
This grouping method has the same effect as creating a group directly from the Data pane.

Visual Grouping
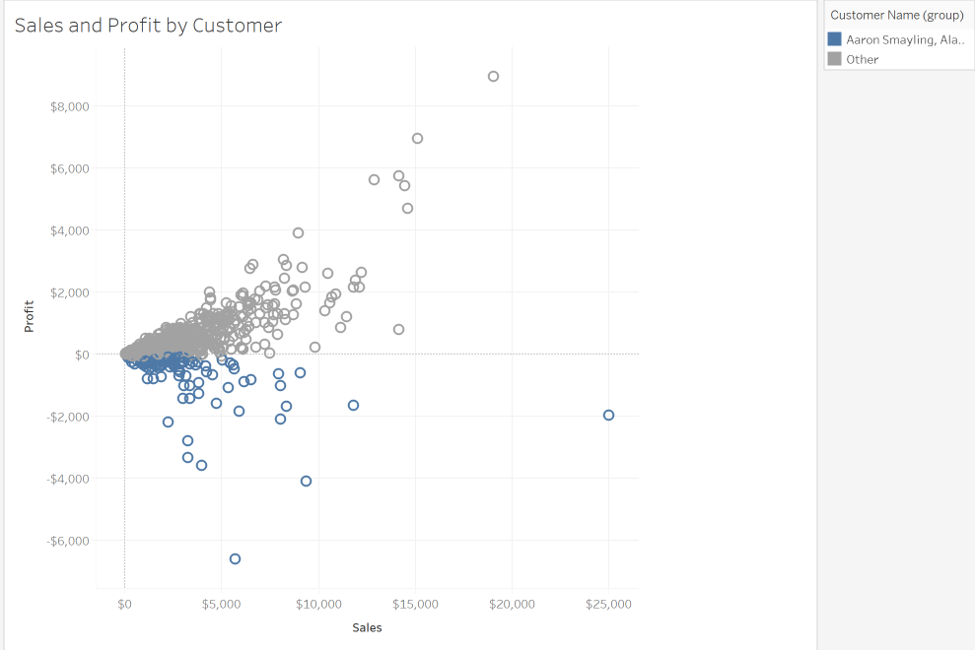
Visual grouping allows you to group data points together by distinguishing groups with the use of color. Unlike header grouping, data points are not consolidated in visual grouping. Consider the following scatter plot.

By selecting data points and selecting the group icon, we can initiate visual grouping.

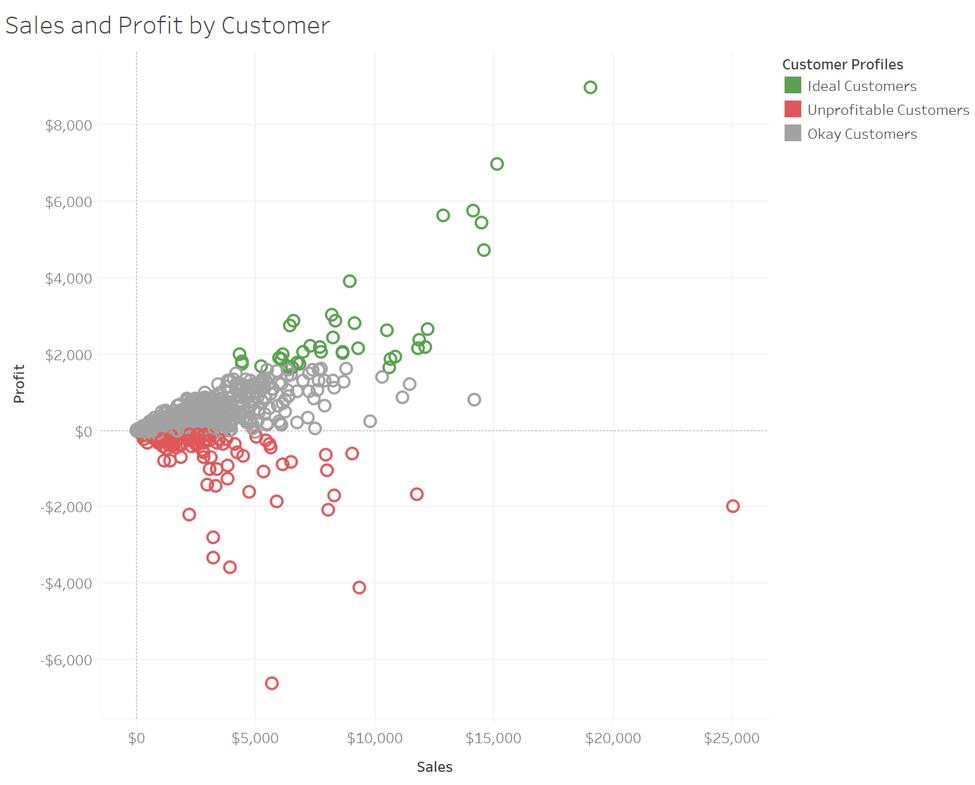
The result is that the color of the data points is changed to distinguish the new group that has been created.
With a bit of additional configuration the visual group could look something like this.
Geographic Grouping
Geographic grouping is very similar to visual grouping. Data points are selected and the colors of the selected data points change as groups are created. The distinguishing factor of geographic groups is that they create new geographic shapes which can be used for mapping. Consider the following map.

When creating geographic groups, it’s important to group on all dimensions (see image below).

As mentioned previously, geographic groups are very similar to visual groups.

The key difference is that if the detailed geographic field (i.e. State) is removed, the new geographic group’s outlines and shapes are kept intact.

That geographic group can then be used to create a map like any other geographic field in Tableau.

Interested to get help solving some of your own problems? Book an office hour and we can work on your data and dashboards together!