By: Eric Parker
Eric Parker lives in Seattle and has been teaching Tableau and Alteryx for 5 years. He's helped thousands of students solve their most pressing problems. If you have a question, feel free to reach out to him directly via email.
Need help with your Tableau dashboards? Sign up for an office hour to work with Eric! Want to dive deep into Tableau? Check out our upcoming Tableau classes!
—
It’s easy to want to cram too much information on a single Tableau dashboard. Whenever I have a scenario where I want to provide additional information to my end user without overcrowding my dashboards, I include an info button.
I most commonly use them for:
● Instructions
● Definitions
● Crediting Data Sources
Take this dashboard as an example:
I did an analysis on how safe it is to climb Mt. Rainier and wanted to acknowledge my data sources since it is public-facing. As you can see, I leveraged an info button in the bottom right corner so that when you hover over it, it lists the data sources.
Here’s how you add info buttons to dashboards:
● Download an info button icon. Ideally you want one with a transparent background so something like this is good.
● Save the file in the location in the image below (note: you will need to create the “Custom Shapes” folder).
● Create a simple calculated field (this will be used to create the info button shape). Something like this works great.
● Create a new worksheet and change the mark type to “Shape”.
● Drop the newly created “Info” field on the shape tab in the “Marks” card.
● Select the “Shape” tab on the “Marks” card, and hit the “Reload Shapes” button.
● Change the dropdown for “Select Shape Palette:” to “Custom Shapes” and select the info button shape.
● Change the worksheet fit to “Entire View”.
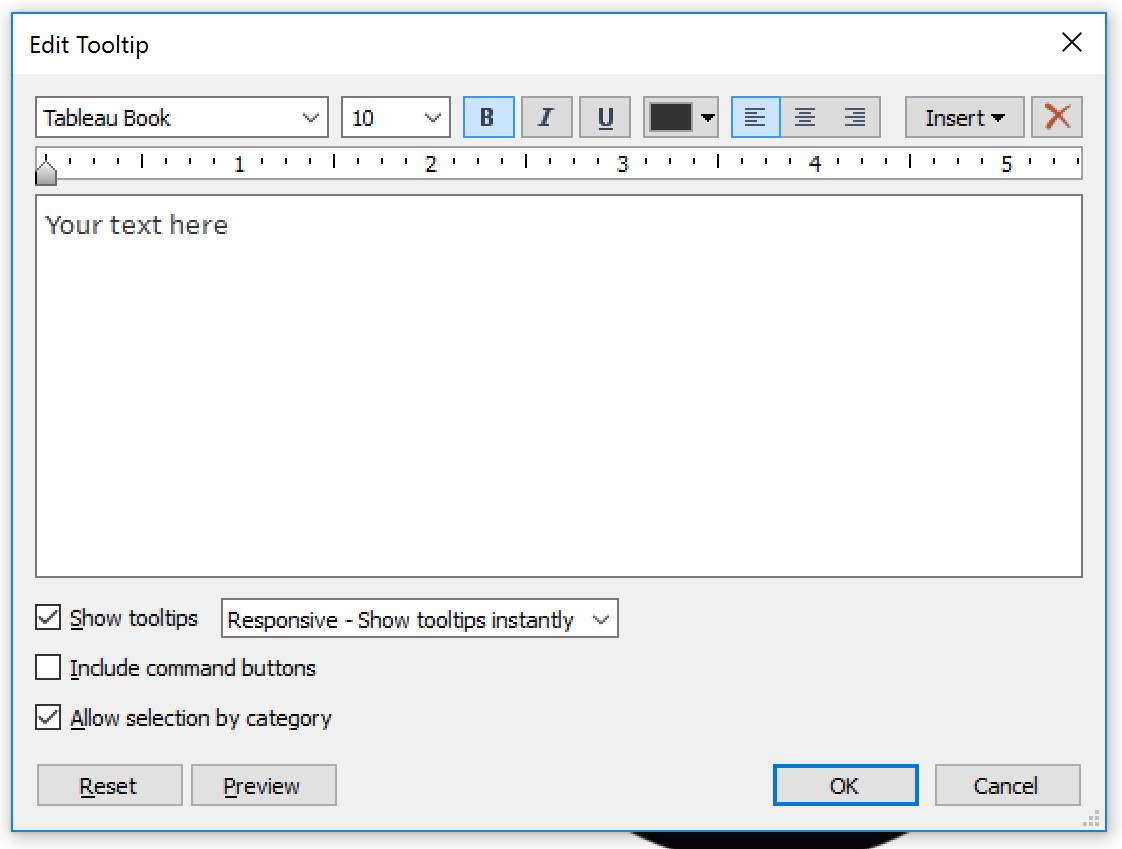
● Select the “Tooltip” tab on the marks card and customize the text as desired.
After that, you now have a working, customized info button to use in your dashboard. If you need additional info buttons, just duplicate the first info button worksheet and customize the text.
Good luck applying this to your dashboards!


