
By: Eric Parker

Eric Parker lives in Seattle and has been teaching Tableau and Alteryx for 5 years. He's helped thousands of students solve their most pressing problems. If you have a question, feel free to reach out to him directly via email.
When calculating growth rates from one date period to another, it’s important to compare apples to apples. For instance, when building a graph in Tableau to compare quarterly sunscreen sales in Seattle, I probably wouldn’t want to compare Q3 Sales (July - September) to Q2 Sales (April - June) because there will be more sales in Q3. The product has a cyclical sales cycle. Instead, I would rather compare Q3 Sales of this year to Q3 Sales of last year to more accurately understand growth rates.
LOOKUP Table Calculation
Let’s look at how to do this in Tableau. If you’d like to follow along I’m going to use the “Sample - Superstore.tds” datasource from the folder structure in the image below. If you have an older or newer version of Tableau, any instance of Superstore will work just fine.

1. Start by creating a bar graph with “Sales” on Rows and “Quarter” (continuous) on Columns.
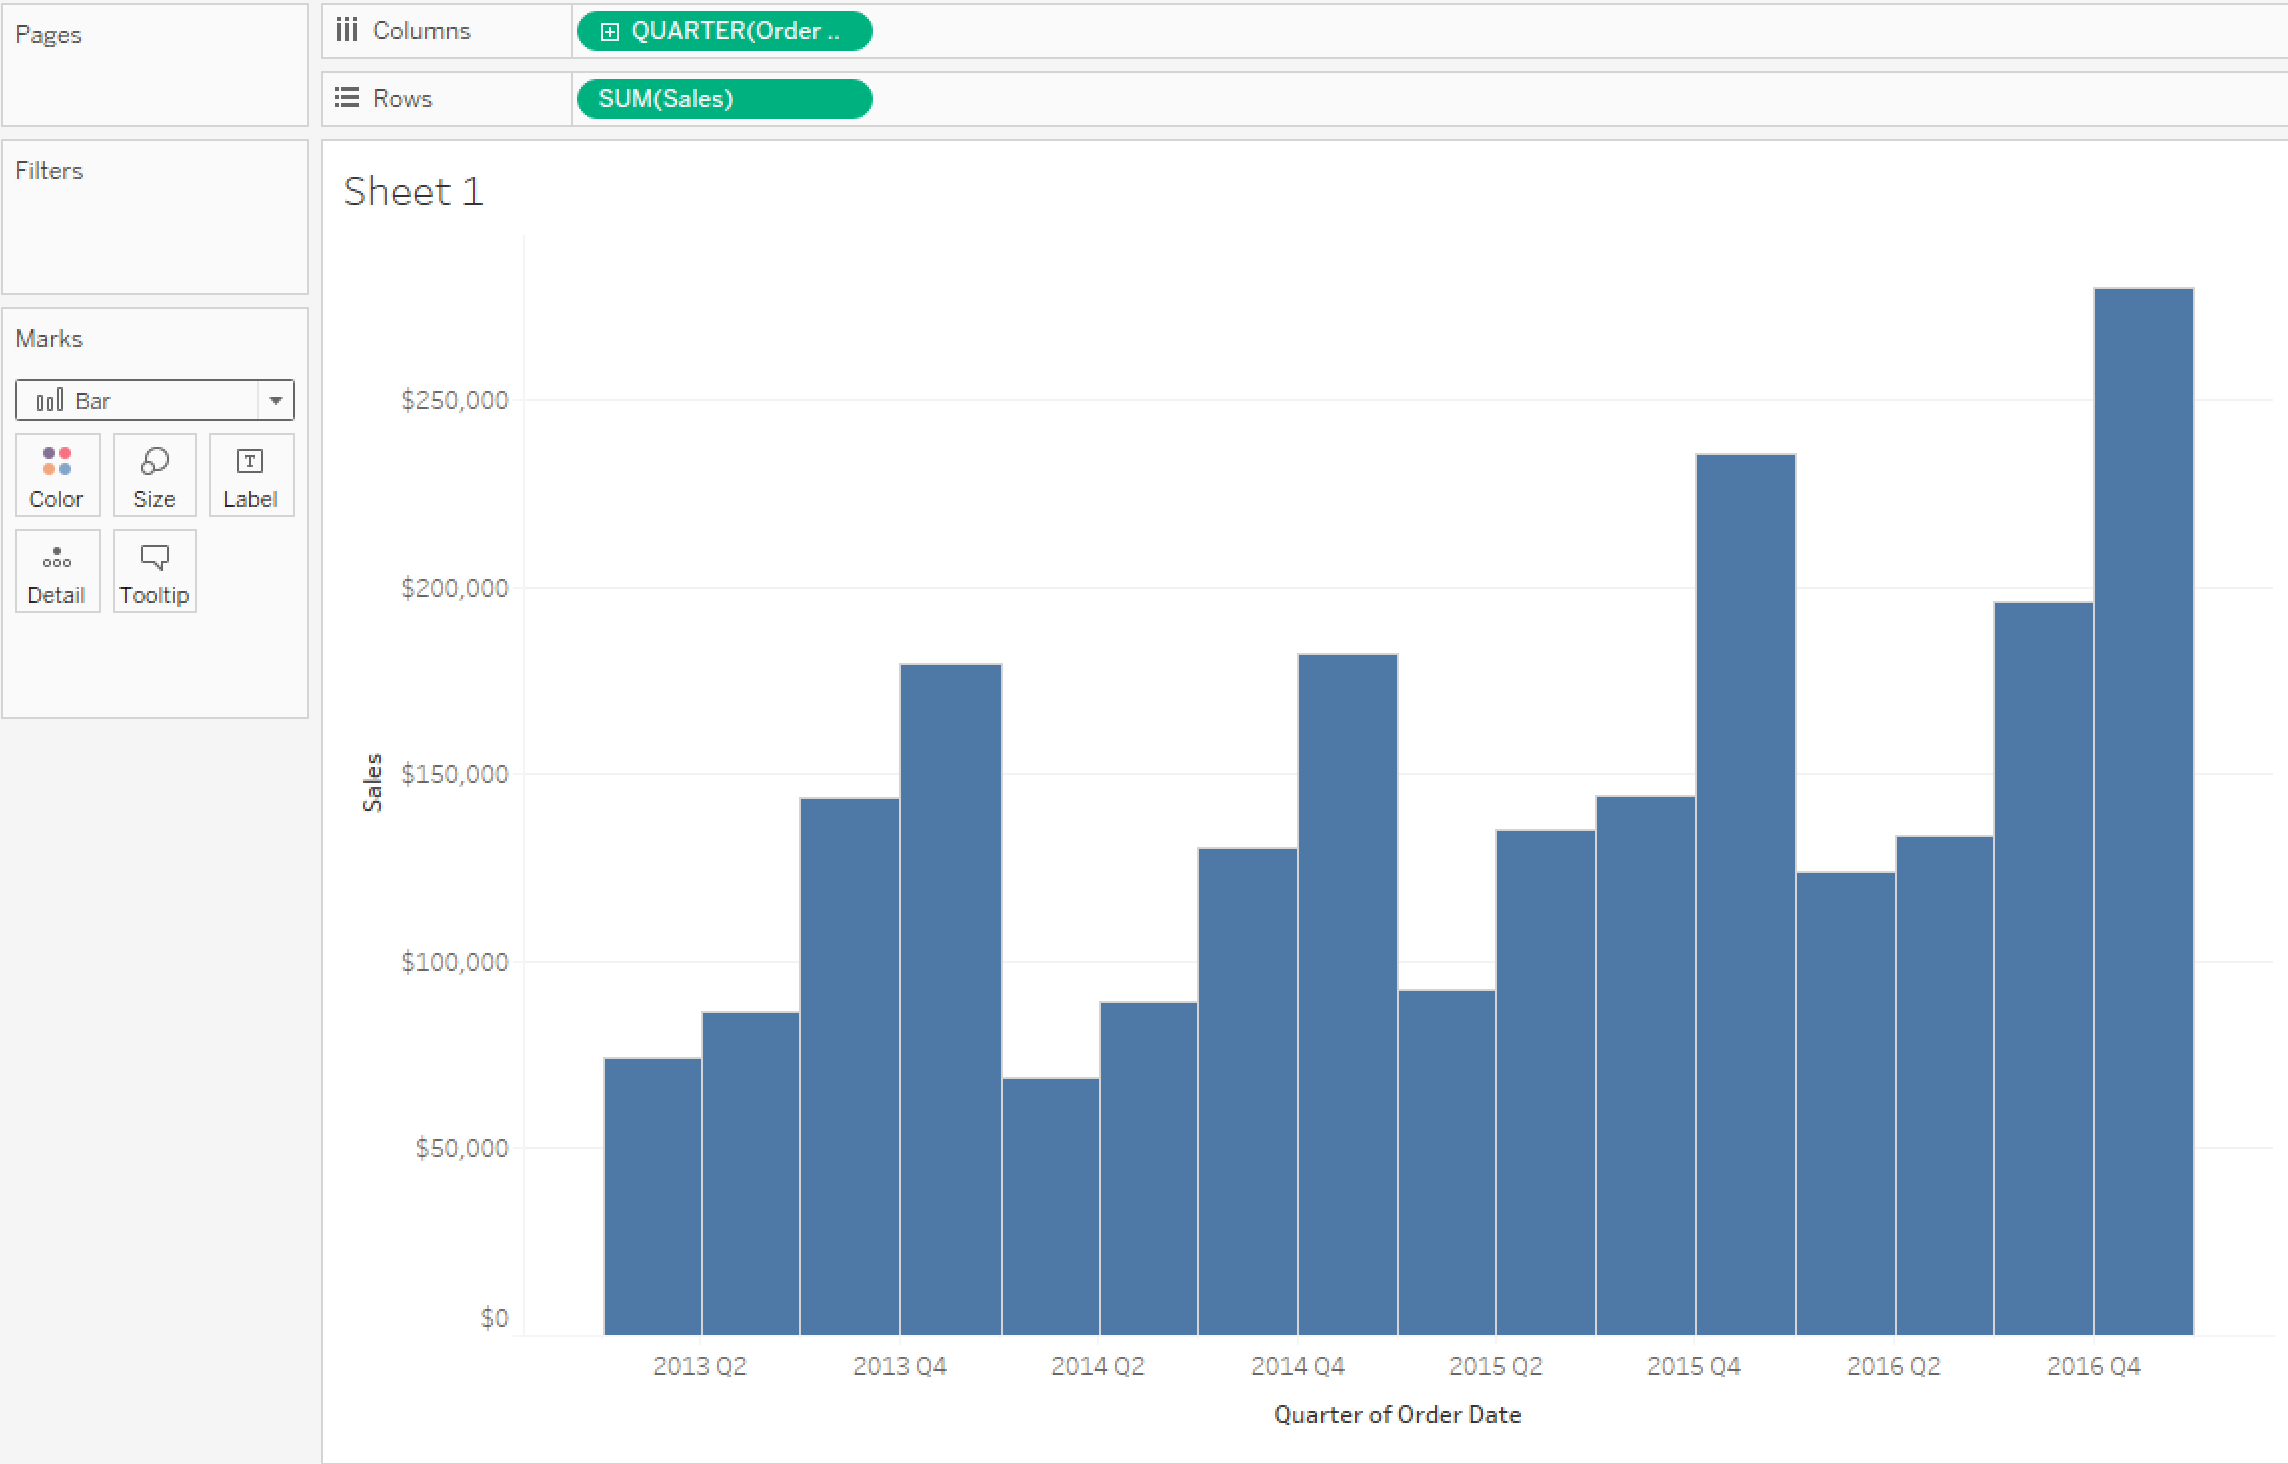
2. Right-click on “Sales” on Rows and select “Add Table Calculation”. From there, create a “Percent Difference From” calculation, computed on “Table (across)”. Notice under the Relative To section the only options are Previous, Next, First and Last. For now, we’ll just choose “Previous”. That means that each quarter will calculate a percent difference from the immediately preceding quarter (rather than the same quarter from the previous year).

3. After applying the table calculation, drag “Sales” from Rows to Measures in the Data Window to save a copy.

4. After giving it a name, right-click on the calculation and select “Edit...”. It should look like this:
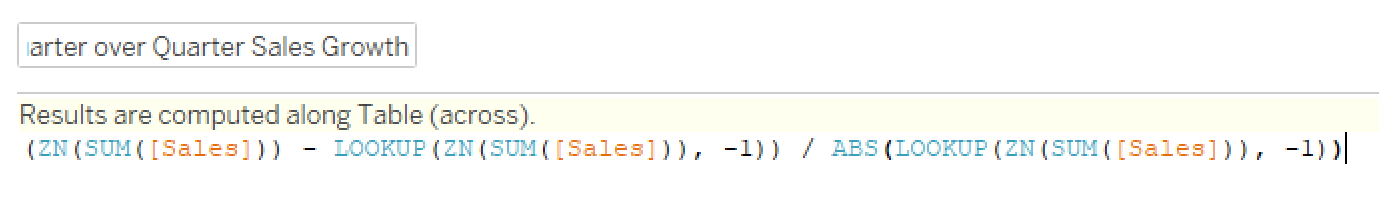
Here’s a brief description of the different functions being used here:
● ZN(): if the expression is null, it returns a 0, otherwise it returns the expression.
● LOOKUP(): the lookup function returns the value of an expression from a specified data point. Because this table calculation is calculated along “Table (across)” and the offset is“-1” the value returned is from the previous quarter.
● ABS(): returns the absolute value of an expression.
5. Change the offset from -1 to -4 in both the numerator and denominator of the calculation to compare a quarter to the same quarter from the previous year.
6. Your output will look like the image below.

There are four nulls because there is no data from 2012 to compare the 2013 sales against. You can hide the indicator if you like.
Why do this?
In scenarios where data is cyclical, like the above, we can better understand growth by comparing like date parts.
Need more help? Please contact us at freesupport@onenumber.biz.