
By: Eric Parker

Eric Parker lives in Seattle and has been teaching Tableau and Alteryx since 2014. He's helped thousands of students solve their most pressing problems. If you have a question, feel free to reach out to him directly via email. You can also sign up for a Tableau Office Hour to work with him directly!
I was recently working on a project where we wanted to compare weekly performance, but it only made sense to compare weeks once they were complete. As a result, we routinely came across situations where we wanted to compare the last full week to the previous full week.
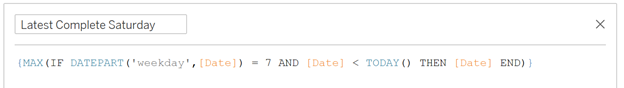
The first step to accomplish this was to establish what day the last full week ended on.
Here’s a calculation which can help calculate the latest complete Saturday.
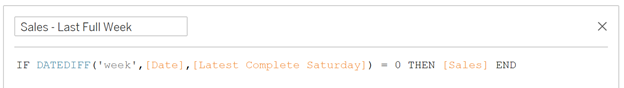
After calculating and verifying that date, we created measures for the last full week and the previous full week.
Here’s what calculating sales for the last full week can look like.
And here’s what calculating sales for the previous full week can look like.

And here’s a calculation to determine the week over week growth rate.

Note: Depending on your data and visuals, you may want to wrap each of the summed values in the ZN() function to convert nulls into 0s. The formula would then read like this.
(ZN(SUM([Sales - Last Full Week])) - ZN(SUM([Sales - Previous Full Week])))
/
ZN(SUM([Sales - Previous Full Week]))
Now that we’ve got those calculations, it’s time to put them into use!
Here’s a very simple worksheet displaying percent difference in sales from the last full week to the previous full week.
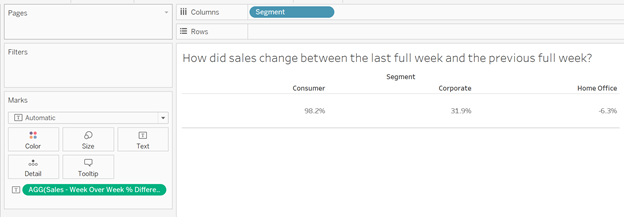
Let’s spice it up and make these summary tiles look nice.
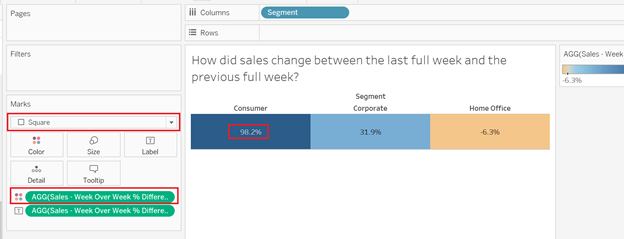
The first few things I will do is add the percent difference calculation to Color on the Marks card, change the mark type to square and center the text. Notice that I formatted the percent value to only display a single decimal point as well.
Next, I’ll drop a copy of the Segment label on the Label section of the Marks card and do some custom font formatting.

Another nice inclusion is to add the sales values to the tooltip so the end user can see the dollar figures on hover over.

One more valuable tweak is to display the date values of the weeks being displayed in the worksheet title. I’ll need one more calculation to do that.
This is the calculation I use to return the Saturday value from the Previous Complete Week.

I then add the Date Value Day formatting of those date fields to the Detail tab on the Marks card and can reference them in the title!

Now I have a chart which will dynamically compare the last complete week to the previous complete week and automatically switch over every Sunday.
Need help working through your own Tableau questions? Feel free to fire me an email or sign up for an Office Hour to supercharge your project!