
By: Eric Parker

Eric Parker lives in Seattle and has been teaching Tableau and Alteryx since 2014. He's helped thousands of students solve their most pressing problems. If you have a question, feel free to reach out to him directly via email.
As a Tableau dashboard designer, I’m trying to always keep in mind that the end user of my products might not be familiar with Tableau. One of the things that makes Tableau different than other tools is its interactivity. For instance, a worksheet filter in a dashboard (selecting a data point in a worksheet to update the dashboard) might not be second nature.
I’ve set up the following dashboard so that you can select one of the circles in the “Sales by Quarter” worksheet and it will update the entire dashboard. It also leaves that quarter filtered until a new value is selected. When the point isn’t actively selected, the end user might not realize it’s filtered down to 2018 Q3.

If I want the 2018 Q3 circle to remain highlighted until a new circle is selected, I can do so by creating a set action.
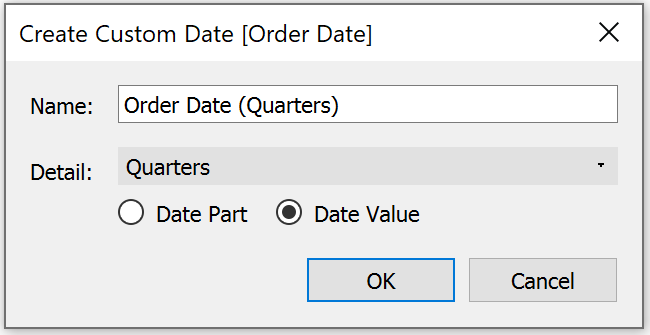
First, we’ll want to create a set. Because I’m using Quarter of Order Date, the first thing I will want to do is create a Custom date value for Date Value quarter of Order Date.
Step 1:

Step 2:
The next step is to create a set based on the quarter of Order Date field.

I’m going to select 2018 Q3 and leave the rest un-selected when creating the set.

Next, I will put the set on color in the quarterly timeline worksheet.

Now to set up the set action, we will navigate back to the dashboard.
From there, we’ll add a dashboard action:

The action type that will be added is a “Change Set Values…” action.

The set action will update the value in the “Selected Quarter” set based on the selection in the dashboard. It will leave the selection until a new circle is clicked.

Now, as new quarters are selected the color of the selected circle updates, helping tie out the actions in the visual for less informed end users.

Need help tackling your own set actions? Sign up for an office hour and we’ll work on them with you pronto!