
By: Eric Parker

Eric Parker lives in Seattle and has been teaching Tableau and Alteryx since 2014. He's helped thousands of students solve their most pressing problems. If you have a question, feel free to reach out to him directly via email.
Imagine you are looking at a Tableau visual and want to view the data translated into your local time zone. Transactions take place all over the country in different time zones but you’d like to see them all in local Pacific Time (for instance).
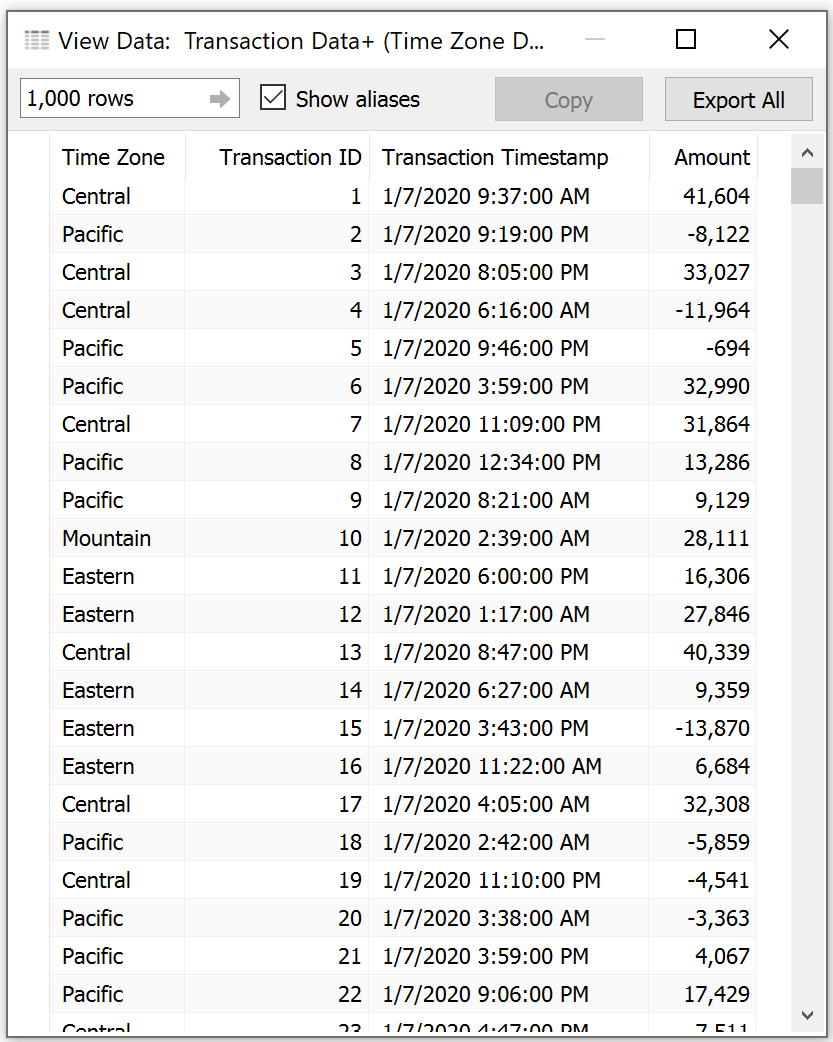
Here is what the data looks like:
Then imagine this is the question we are trying to answer, “How much money in total was deposited during the 9 am hour, Pacific time?”. However, this also needs to be dynamic so an end user can change the time zone or hour.
First, we can create a parameter with the desired time zone options. For the sake of simplicity I’ve just chosen Pacific, Mountain, Central and Eastern.

Next, we can add a calculation that will know based on the time zone in the parameter and the listed time zone for the row of data, how many hours to add or subtract to translate the listed date into “local” time. Note the nested IF statements to keep things organized.

The final calculation is to use the DATEADD function to add or remove the previous calculation from the existing timestamp.

All the fields can then be used together to display the total dollar amount of deposits during the 9 am hour Pacific. Notice the “Time Zone” and original “Transaction Timestamp” fields are included to help demonstrate what the original time was versus what it translated to in Pacific time.

Interested in recreating this or working on your own issue with dates in Tableau? Feel free to reach out or sign up for an office hour and we can help you get on track.