
When creating averages on a measure in Tableau, null values aren’t factored into that average. Take this table for instance:

If we created a worksheet in Tableau displaying the average scoops of ice cream per person, the overall average will be 2 (8 divided by 4) not 1.6 (8 divided by 5).

Tableau acts like the null row of data doesn’t exist when computing an average. However, let’s say that in your scenario, any place where the data is null, there should be a 0. So in the case above, there is no number after William because he didn’t get a scoop of ice cream and we want this factored into the average.
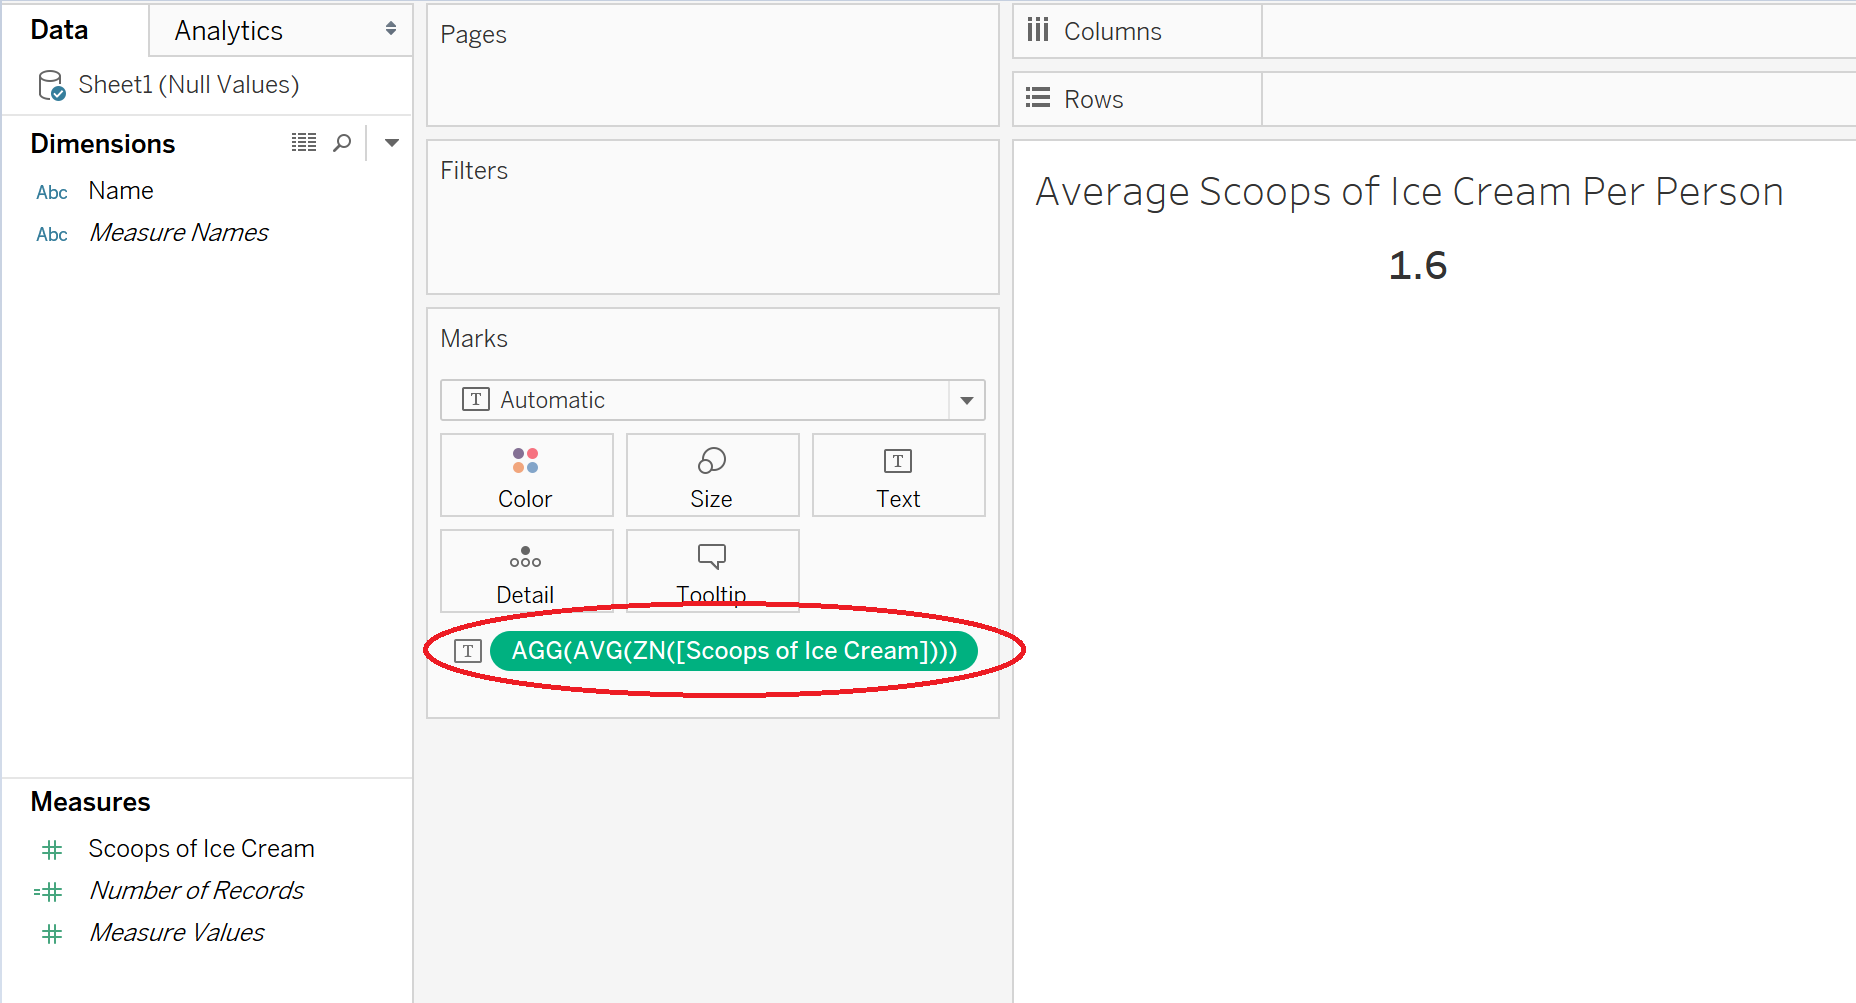
This is the perfect use case for the ZN() function. This function replaces anywhere that there is a null with a 0. After applying the ZN() function, the average will drop from 2 to 1.6
Need more help? Please contact us at freesupport@onenumber.biz.