By: Eric Parker
Eric Parker lives in Seattle and has been teaching Tableau and Alteryx since 2014. He's helped thousands of students solve their most pressing problems. If you have a question, feel free to reach out to him directly via email. You can also sign up for a Tableau Office Hour to work with him directly!
A student in one of my Tableau classes recently told me they were searching for a solution to one of their problems and came across my blog post Month to Date vs. Previous Month to Date in Tableau. Score!
I asked if it solved his problem and he mentioned that his use case was slightly different. Instead of answering the question, “How do month to date sales compare to previous month to date?” he was trying to answer, “How do month to date sales compare to month to date sales for each month from the past year?”
The solution would look something like this.
I am writing this on June 9th, 2021 and have a data set with (nearly) daily data ranging through today’s date.
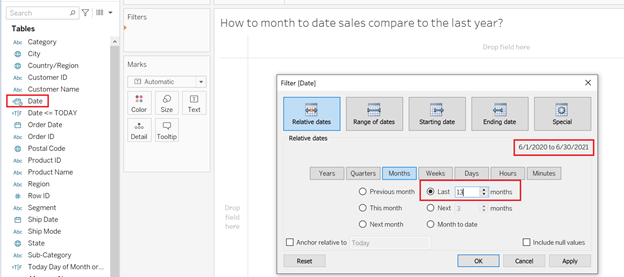
The first thing I can do in a new worksheet is add the [Date] field to the Filters card and add a relative date filter keeping data from the last 13 months.
The next step is to create a calculated field which only keeps data from this day of the month or earlier for each month.
That field can also be added to the Filters card with only “True” values kept.
The next steps are to add MONTH of [Date] to the Columns shelf (ensure this displays month and year) and SUM(Sales) to the Text tab on the Marks card.
Now, we need to calculate Month to Date differences by percentage. The first step is to create a calculation which returns month to date sales.
Here’s one way to write that calculation.
Here’s the code from the image above:
LOOKUP(SUM([Sales]),LAST())
This calculation ensures that the month to date sales are returned, even when the column represents data from a previous month.
Note: The calculation above uses two table calculation functions, LOOKUP and LAST. That means this will only return the latest month to date sales in the worksheet because June 2021 is the last month when the table calculation is running Table (across). The LOOKUP function allows the latest month values to be calculated against previous month values.
The next step is to create a calculation which returns the growth percent when comparing month to date sales to month to date sales from previous months.
I like seeing +/- in front of the percentages on the labels. Here’s the custom number formatting you need to see a + or - before each percentage value.
Here’s the code: +0.0%;-0.0%
Here are a few final steps to get your worksheet to look like the image at the beginning of this post:
● Add the growth % calculation to the Text tab on the Marks card,
● Convert the worksheet into a highlight table (hint: change the mark type to square and add the growth % field to the color tab on the Marks card)
● Apply custom text formatting!
And the final output can look something like this!
Looking for help with your own Tableau project? Book a Tableau Office Hour!


