
By: Eric Parker

Eric Parker lives in Seattle and has been teaching Tableau and Alteryx since 2014 He's helped thousands of students solve their most pressing problems. If you have a question, feel free to reach out to him directly via email. You can also sign up for a Tableau Office Hour to work with him directly!
A few months ago, a blog reader, Om Parekh, reached out to me with a question. He was working on a project where he needed to compare each day to the same day the previous year. For instance, how did the third Wednesday in February, 2020 compare to the third Wednesday in February, 2019?
The goal was to create something like this.

My mind initially raced to creating a custom calendar like we’ve referenced in the past when talking about comparing business days. However, it became clear that would require a good amount of overhead to maintain and it would be preferable to have a simpler solution.
As Om and I emailed, he pointed out an obvious path I’d overlooked. If you want to compare a day to that comparable day last year, you need to simply go back exactly 52 weeks (or 364 days). With that knowledge in hand, a simpler solution was much more possible.
For the purposes of the examples in this blog post, I created my own data set. It’s very simple, just two columns, [Date] and [Sales]. It contains a single row of data for each day in 2020 and 2019.

We can get start building this comparison by putting Date Part Year of [Date] and Date Part Month of [Date] on the Columns shelf and Date Part Day of [Date] on the Rows shelf.

Doing that gives us a calendar framework to use as our jumping off point.
To calculate percentage growth, we are going to need a method to return both the current year sales and the comparable previous year sales in the same cell.
Current year [Sales] is simple. Just drag the [Sales] field to the Text tab on the Marks card.

Calculating the prior year sales is going to require a calculation. This is where 364 days comes into play.

The LOOKUP function allows you to compare one data point against a previous data point in the worksheet.
I am going to drop the [Prior Year Sales] calculation on the Tooltip tab in the Marks card and ensure the scope and direction of the table calculation are set to “Table (down then across)”.

The scope and direction matter because that’s how Tableau knows what the “364” value in the LOOKUP function refers to. By systematically moving down then across, 364 values ago should compare a selected date to the comparable date in the previous year.
(Side-note, this approach will only work as long as there are no gaps in your data. For instance, if there were no rows of data for certain dates, looking back 364 values will go farther back than you intend because it will skip over missing values.)
After adding the calculation to the tooltip, here is what January 1, 2020 tooltip looks like.

The January 1, 2020 value is 20,277 and the prior year comparable value is 8,566. That 8,566 value is from January 2, 2019.

January 1, 2020 was a Wednesday.

And January 2, 2019 was also a Wednesday!

The most challenging part of setting this up is done! Now, it’s just a matter of another calculation and some formatting.
A [Percent Difference Year Over Year] calculation should look like this.

I’ll move both the sales fields to the tooltip, add the [Percent Difference Year Over Year] calculation to the Text tab on the Marks card, and make sure the new table calculation is also set to Table (down then across).

Changing the visual to a highlight table by changing the mark type to square and adding the percent difference calculation to the Color tab on the Marks card adds visual cues which aid in identifying where increases and decreases year over year were largest.

Notice in the previous visual that 2019 does not have a prior year to compare to so all those values are blank.
If I only want to look at 2020 and don’t need this worksheet to be dynamic, I can hide the 2019 data. It’s important to hide, not filter, because if you filter out the prior year, the 2020 data will no longer have the 2019 data available to compare against.

If you want the end user to be able to dynamically select which year(s) display, that’s a possibility as well, but it’s going to require some table calculation trickery.
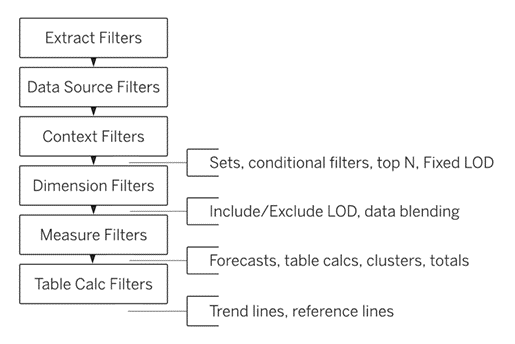
In Tableau’s order of operations, Table Calculation Filters are processed after Table Calculations.
That means if we can filter out the year field using a Table Calculation filter, it will effectively be the same as hiding the values rather than filtering them out.
One way to do this is to use a LOOKUP table calculation function to lookup the current value. Here’s what that looks like when I want to look up the year of the existing data point.

So now after a little custom formatting, changing the [Year Filter] field to Discrete and adding it to the Filters card, my end user can control which year(s) are displayed in the visual.

Solving this problem was trickier than I originally anticipated, but I’m glad we were able to come up with a solution that will require a lot less maintenance long-term than managing and updating a custom calendar for comparisons.
Need help working through your own Tableau questions? Feel free to fire me and email or sign up for an Office Hour to supercharge your project!