
By: Eric Parker

Eric Parker lives in Seattle and has been teaching Tableau and Alteryx since 2014. He's helped thousands of students solve their most pressing problems. If you have a question, feel free to reach out to him directly via email.
Need help with Tableau? Sign up for an office hour to work with Eric! Want to dive deep into Tableau? Check out our upcoming Tableau classes!
—
I was recently working on a project that incorporated building management. One aspect of the management of the buildings was to ensure that regular inspections were done on each floor of each building weekly.
A simplified version of our weekly data might look like this.

One of the top questions we received was, “Who has performed an insufficient number of inspections this week?”. As we were answering that question it became apparent that the larger buildings were a bigger liability than smaller buildings.
The end goal of our analysis was to be able to provide a table which listed building inspection rates and sorted them first by inspection rate and second by number of building floors.

That turned out to be more challenging than I thought.
To get things started I added [Site ID] to the Rows shelf, added [Number of Floors] as a Discrete field on the Rows shelf and created an [Inspection Completion %] calculation which I placed on Text in the Marks card.

Sorting on a single measure is simple enough. If I want to see sites with the lowest inspection rates first, I can hit the ascending sort icon in the toolbar.

Notice however, that the three sites with a 0% rate are then sorted alphabetically or what Tableau refers to as “Data Source Order”.
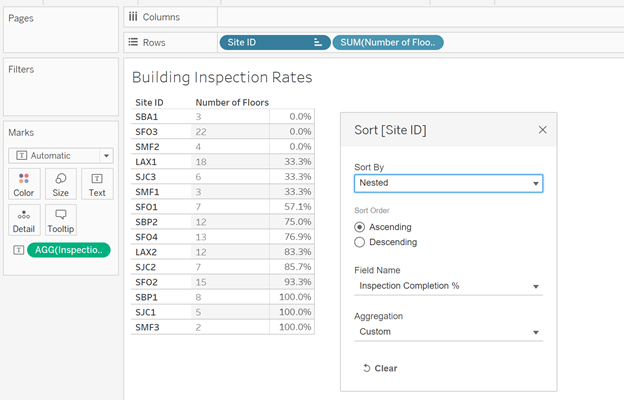
Even if I delve deep into the custom sorting options in the [Site ID] field on the Rows shelf…

...there still isn’t an option to sort by the smallest [Inspection Completion %] followed by highest [Number of Floors] in a Nested fashion.
Now maybe I’m just dense or missing something obvious, but this is where I was temporarily stuck.
I decided that the easiest solution might be to create a custom calculation to sort on (what a shock to you regular blog readers haha).
Here is what worked for me.

Let’s break this down.
● RANK_UNIQUE: RANK_UNIQUE is different from RANK in that it doesn’t allow ties. It breaks ties by rewarding earlier alphabetical values with a value closer to 1. That’s unlikely to happen with this data but I still like to use it.
● 1/(1 + [Inspection Completion %]): Since RANK is a descending (highest value returns a rank of 1) function by default, I want lower values (i.e. 0%) to formulate as a higher number here. If the [Inspection Completion %] is 0% then this formula will return a 1 but if that completion % is 100% then this formula will return 0.5.
● + (.001 * AVG([Number of Floors]): This section is very important because it serves as the tiebreaker in the event that [Inspection Completion %] is the same between two buildings. A building with 2 floors will return .002 but a building with 9 floors returns .009.
Notice that adding this new [Sort Rank] function to the Rows shelf, turning it into a Discrete field and placing it before the existing dimensions returns the results we want.

Sites are now sorted first by [Inspection Completion %] (ascending) and then a nested sort occurs where sites with a higher [Number of Floors] rank above sites with less floors when their completion percentages are the same.
To turn this text table into the highlight table you saw at the beginning, we just have a few formatting steps to undertake.
The [Sort Rank] field on Rows can be hidden (deselect “Show Header”).
The worksheet mark type can be switched to square to create a highlight table.
[Inspection Completion %] can be added to the Color tab in the Marks card.
A second measure can be added to the view and hidden so the title of the measure in focus (Inspection Completion %) shows up at the top of the column.

Want help or advice with your own Tableau visuals? Sign up for an office hour and we’ll spend some concentrated time helping you out!