By: Eric Parker
Eric lives in Seattle and has been teaching Tableau and Alteryx for 5 years. He's helped thousands of students solve their most pressing problems. If you have a question, feel free to reach out to him directly via email.
Creating a calendar visual in Tableau can be an effective way of communicating data-based information to your end user. For example, using a calendar in an effective way of seeing that sales are highest on Saturdays for this restaurant:
Even though calendars aren’t one of the default visuals you can create in Tableau, they aren’t that difficult to create either.
Let’s walk through how to recreate the above calendar.
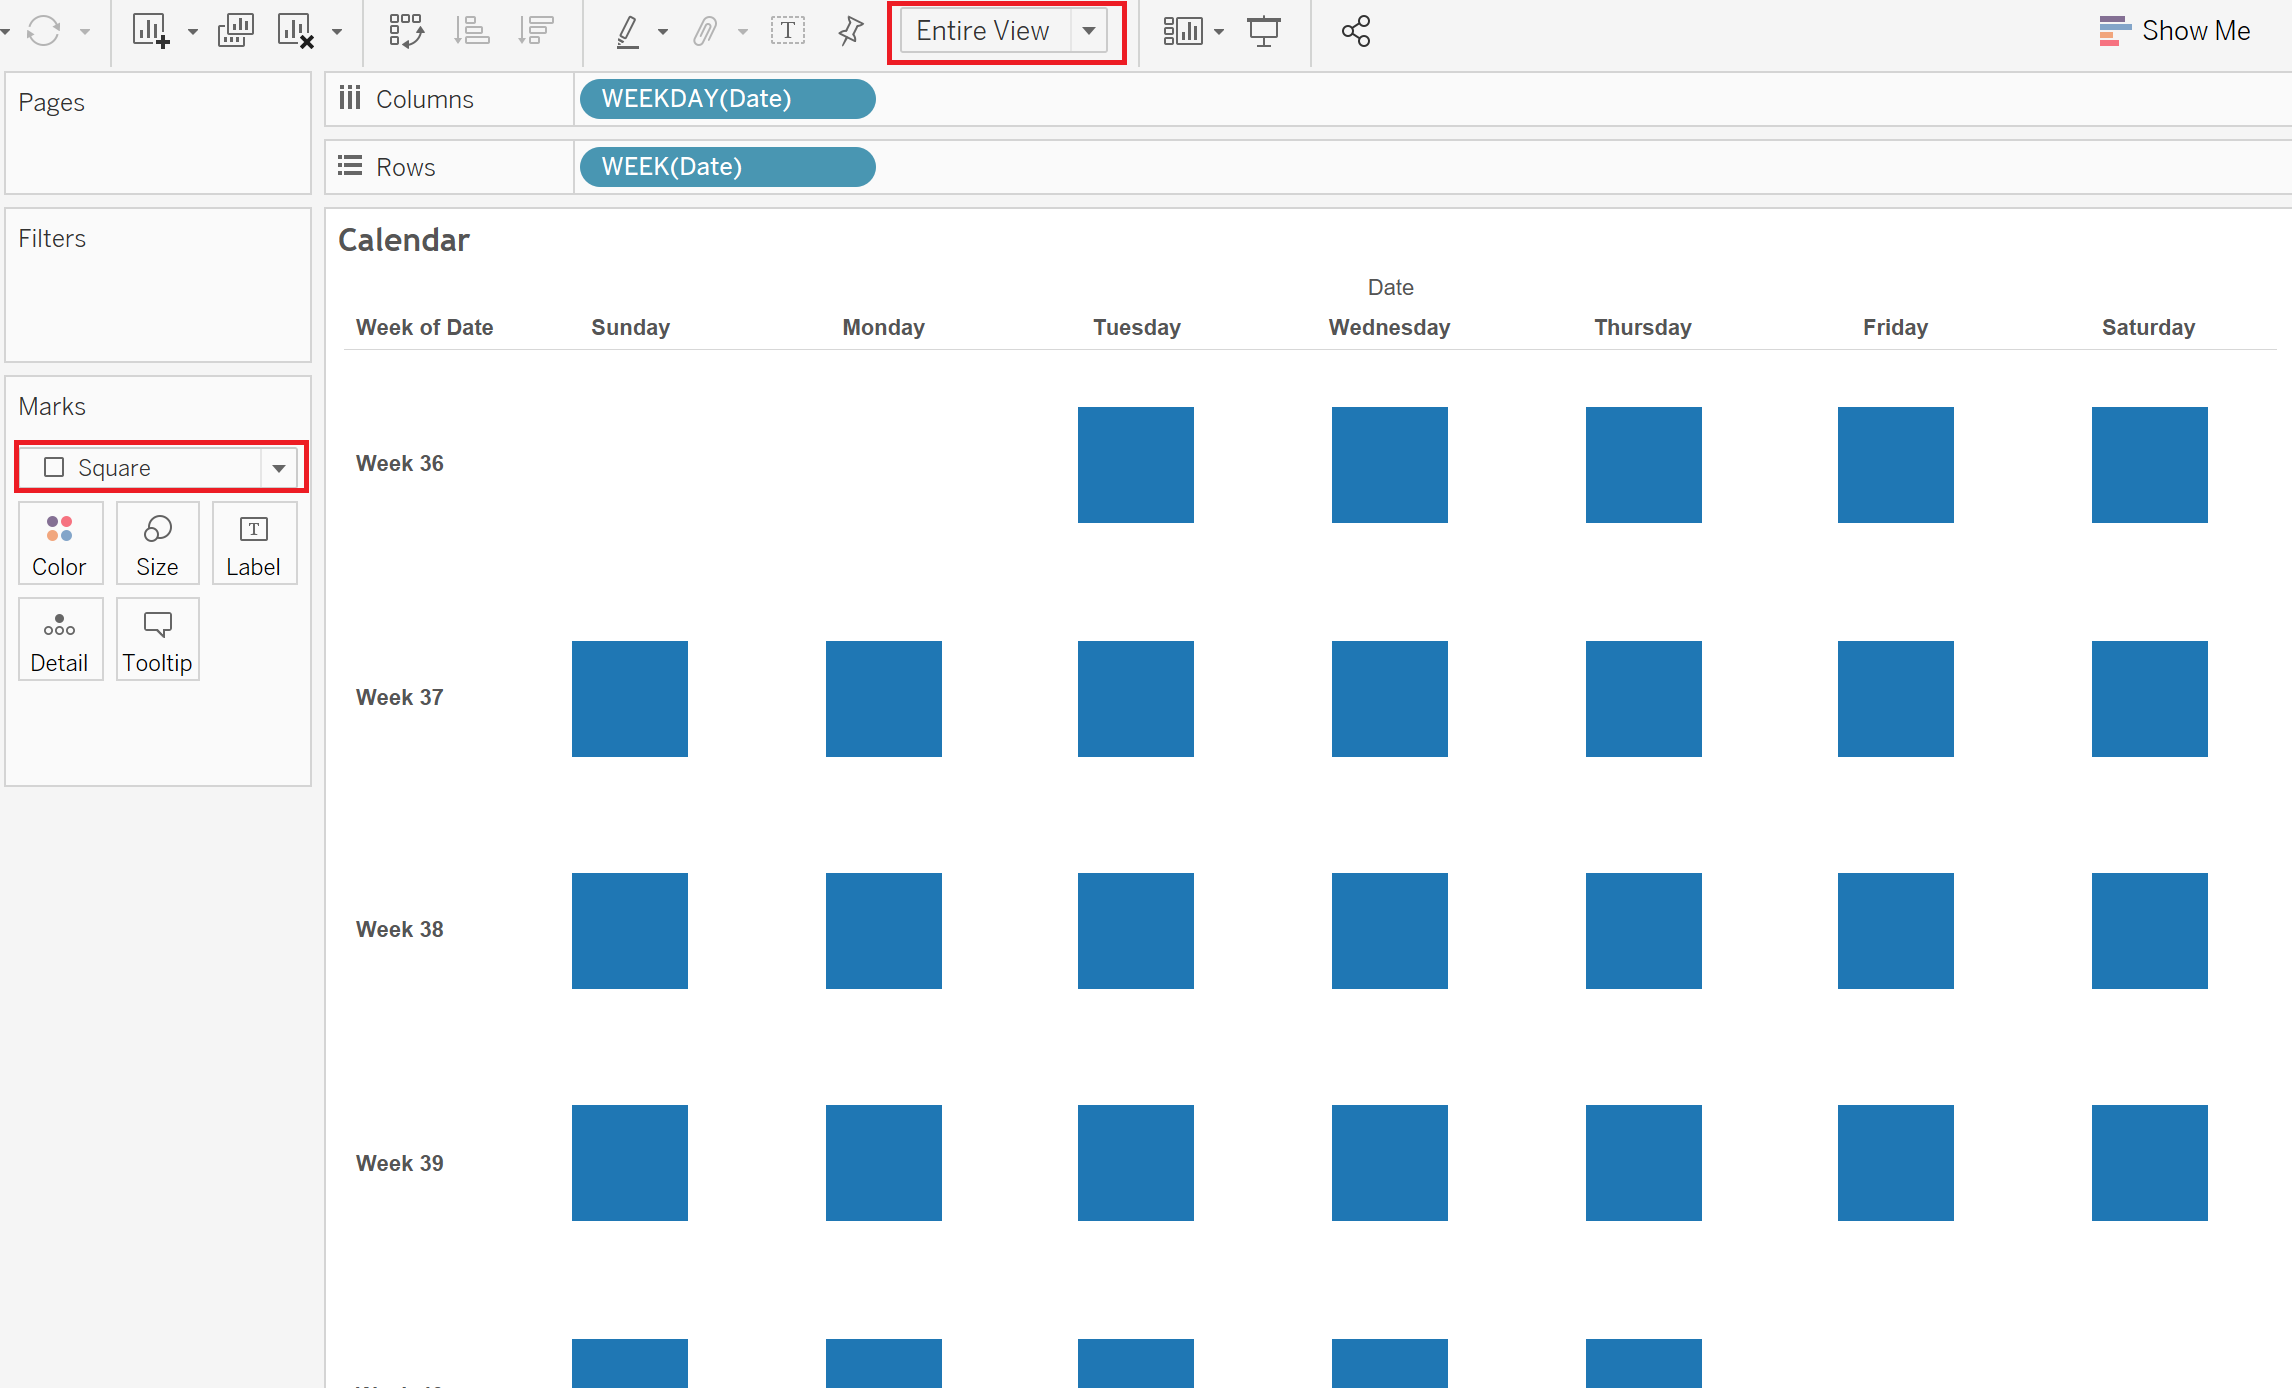
We’ll start by taking Week of Date to Rows and Weekday of Date to Columns.
(Note, right-clicking and dragging dates makes selecting Week and Weekday significantly easier.)
Next, we will change our mark type to “Square” and set the fit of the worksheet to “Entire View”.
After that, we’ll drag a field to Color on the Marks Card and pick an appealing color palette. You can even add a border at this point if you want to create clearer separation between the squares.
Now, it’s just a matter of doing some formatting to get all the details to look the way we want.
For instance, dropping Day of Date on Label in the Marks Card can be helpful. By default it’s going to read out longhand (i.e. September, 1, 2015) so I like to do some formatting to shore that up. For the most flexibility in formatting use the Continuous/Date Part Day of Date.
Then, you can right click on that Day of Date pill, select “Format” and customize the display appearance.
Next, we’ll add a measure to Label in the marks card as well. After some custom formatting, resizing and alignment (mostly done in Label on the Marks Card) we are pretty close.
The last couple tweaks I make are usually just hiding unnecessary headers.
After all that work, we have our finished product!
Want help with your own Tableau questions? Sign up for an office hour and we’ll help you!


