
By: Eric Parker

Eric lives in Seattle and has been teaching Tableau and Alteryx for 5 years. He's helped thousands of students solve their most pressing problems. If you have a question, feel free to reach out to him directly via email.
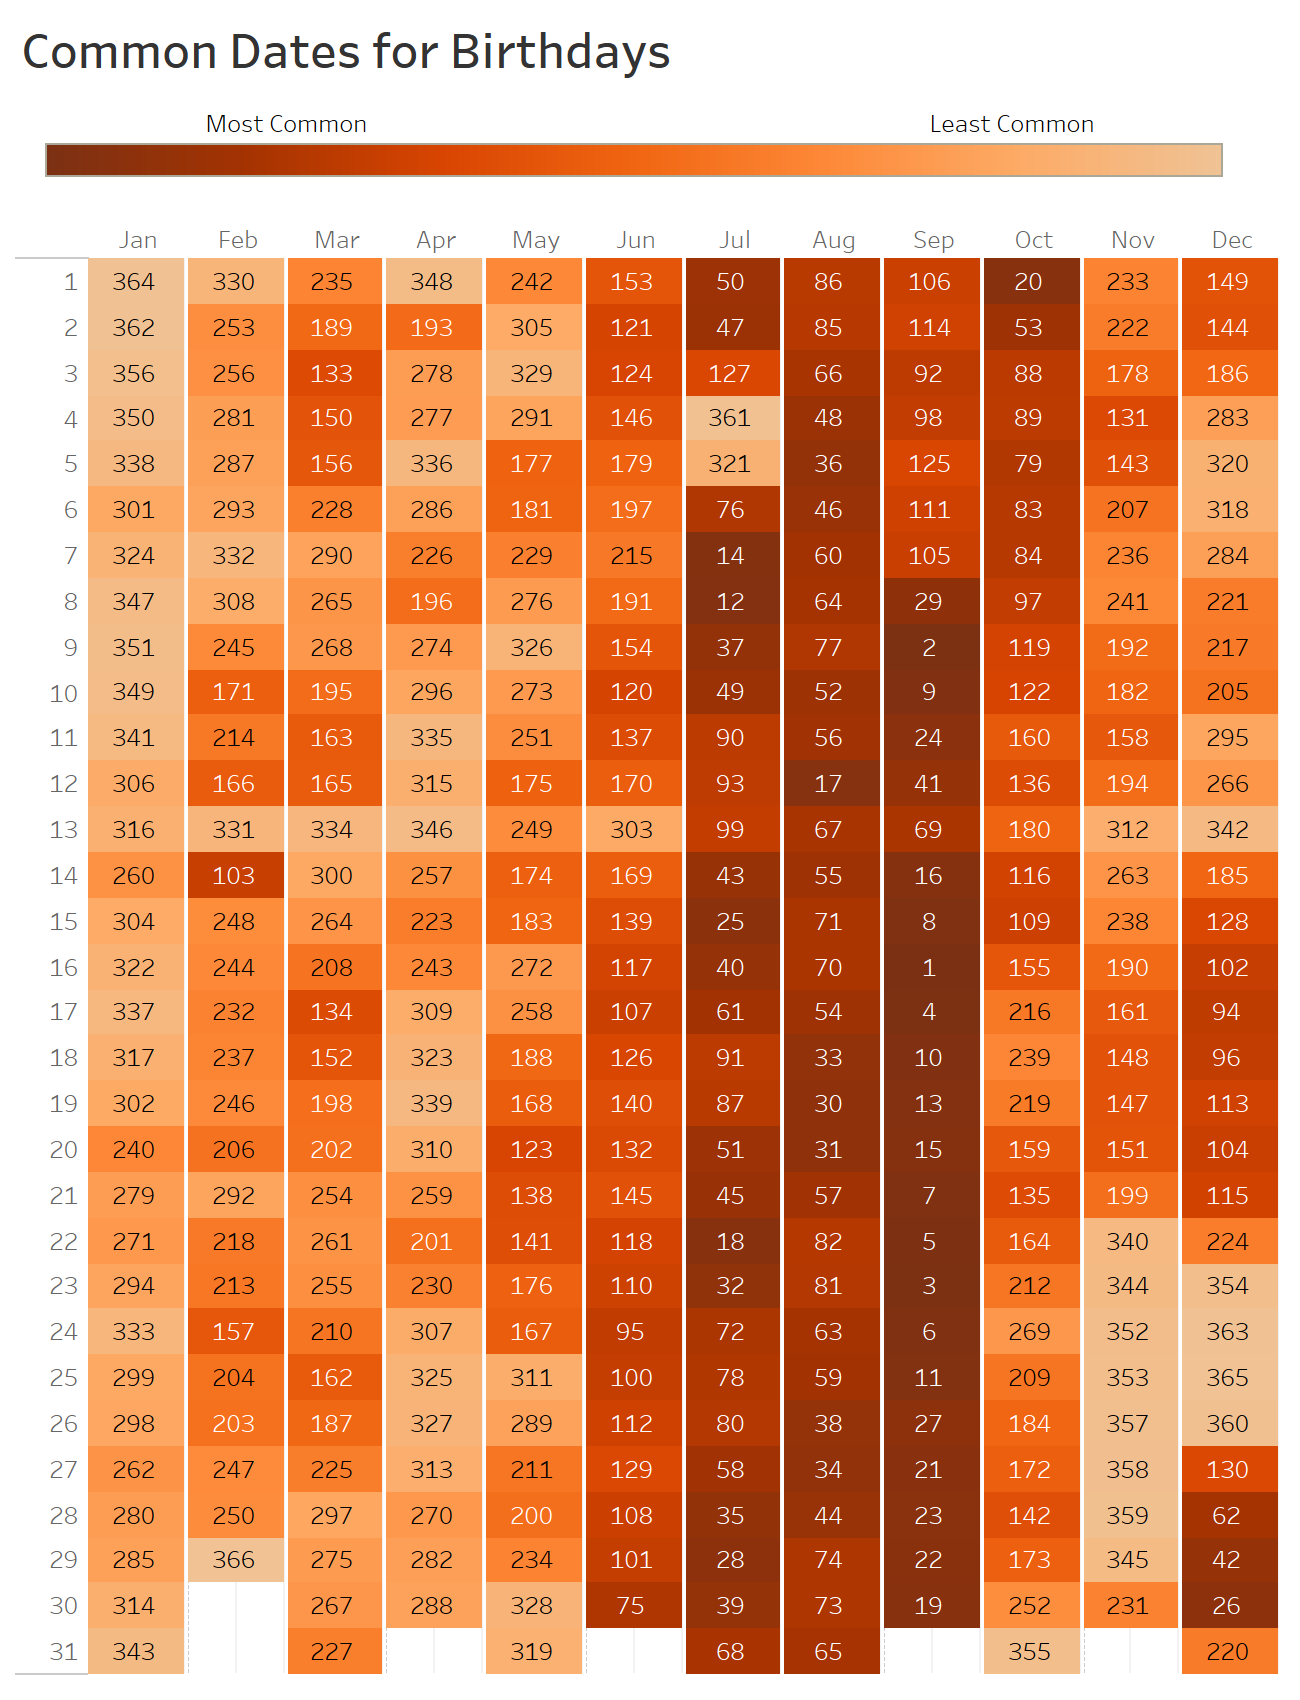
In teaching Tableau, I came across a visual I think is really fun and interesting.

Special thank you to Andy Kriebel at VizWiz for creating the initial version of this dashboard.
As you can see, the darker the cell, the more common that birthday is. The data comes from the New York Times and represents all births in the United States between 1973-1999.
While you can easily spot some big trends (i.e. July-September birthdays are popular) you can’t see the actual rank in this dashboard without hovering over a square. I wanted to see what the highlight table look like when I added the rank labels and I quickly realized it was too much information.
Then I got to thinking that maybe it would be cool to easily be able to exclusively label the top 10 or bottom 10 values. I decided I wanted the end user to control what was showing on the labels so I created a parameter with these values.

Then, I created a calculated field which referenced those values from the parameter and would only generate labels in accordance with what has been selected in the parameter.

A few notes about this calculation:
● A CASE statement is like a condensed IF statement but more efficient when you need to reference numerous values. Unlike an IF statement, with a CASE statement I only need to reference the parameter once at the beginning.
● For the “Bottom” options, I ranked ascending (‘asc’) which means values are ranked low to high. That means if the fewest births occurred on February 29th, that would be ranked 1. That logic allows me to easily keep the bottom 10 or bottom 25.
● I generally didn’t include “ELSE” in my IF statements. If you don’t include ELSE, Tableau assumes that it should return null anywhere the criteria in the IF statement wasn’t met.
After adding the calculation to Label on the Marks card of the highlight table, I needed to make sure that the RANK table calculation was being applied on Table (across then down). The reason that is important is so that Tableau knows that you are looking for a top 10 rank across the entire worksheet, not just the top 10 in that row or column.

After showing the parameter control in the dashboard, the result is a dropdown which the end user can alter to label only the points of immediate interest.

Feel free to check out the interactive version of this dashboard and download it for testing here: Common Dates for Birthdays with Dynamic Labels.
Want help coming up with solutions to your own unique Tableau problem? Book an office hour or reach out directly!