
A client recently challenged me with the question, “How could I show a bar chart in Tableau that shows values for the top 10 displayed as 10 individual bars but group all the rest of the values into a single bar called “other”. The idea was to create this:

I’ll be honest, I got stumped trying to solve this. This is the first thing I tried:
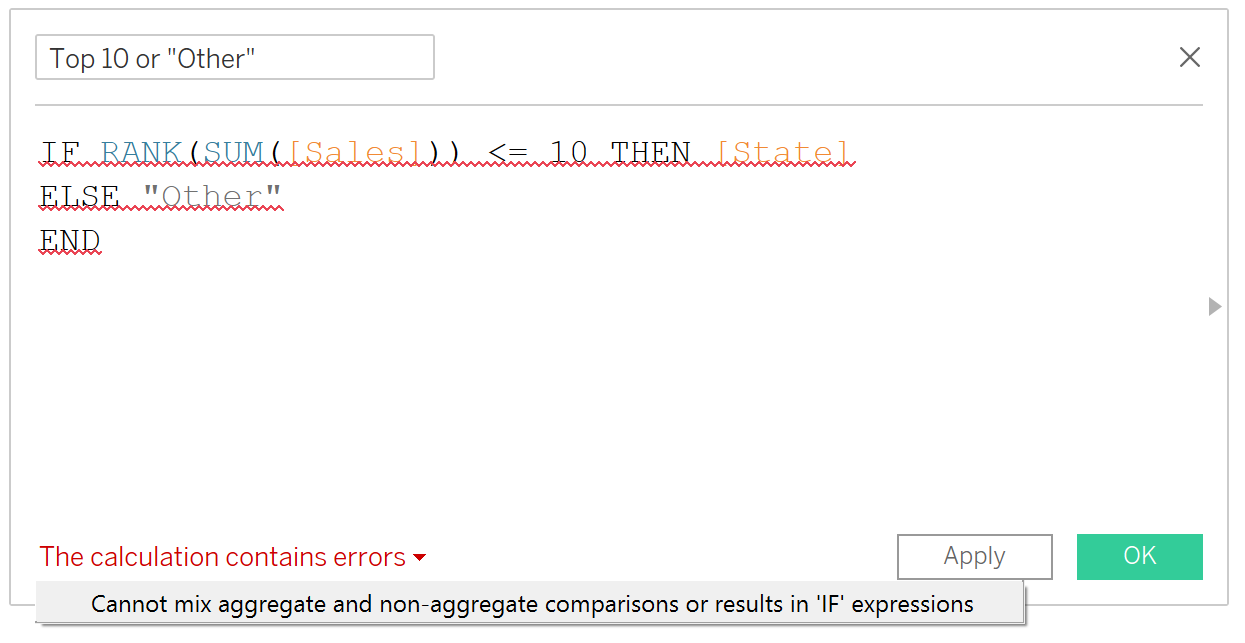
This is the right general way to think about the problem but as you can see, Tableau doesn’t want aggregate (SUM([Sales])) and non-aggregate expressions ([State]) mixed together in the same calculation.
All credit goes to my client for solving this (good job John!). He realized the way to get Tableau to allow this was by using a set.
The first step is to create a set based on the State field that contains the top 10 States by Sales.

The next step is to create a calculated field based on that set which shows a state name if it is part of the top 10 and consolidates all other states into a single value.
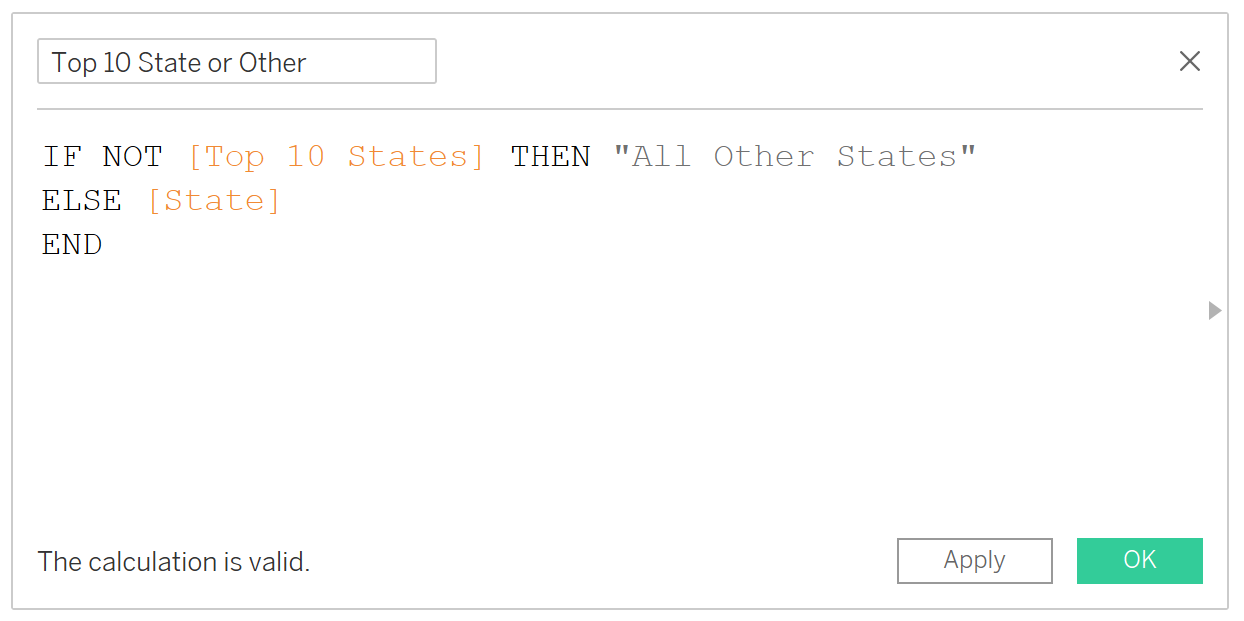
The last step is to put that new calculated field to use!

Need help with your own Tableau problem? Call John! ;-)
If you need help, I’m always available via office hour.