Totals in Tableau are notoriously rigid. You can’t add two totals lines; one for summarized values and one for averaged values, in the same worksheet. You can have one, the other, or allow Tableau to use a field’s default aggregation for totals.
Have you ever run into a scenario where you’d like to see both the sum and average of a value on a single worksheet?
Take this image for instance:
After turning the totals on, we can see that the total overall sales figure across all four regions is about $2.3M.
Now what if we want to know the average per region as well?
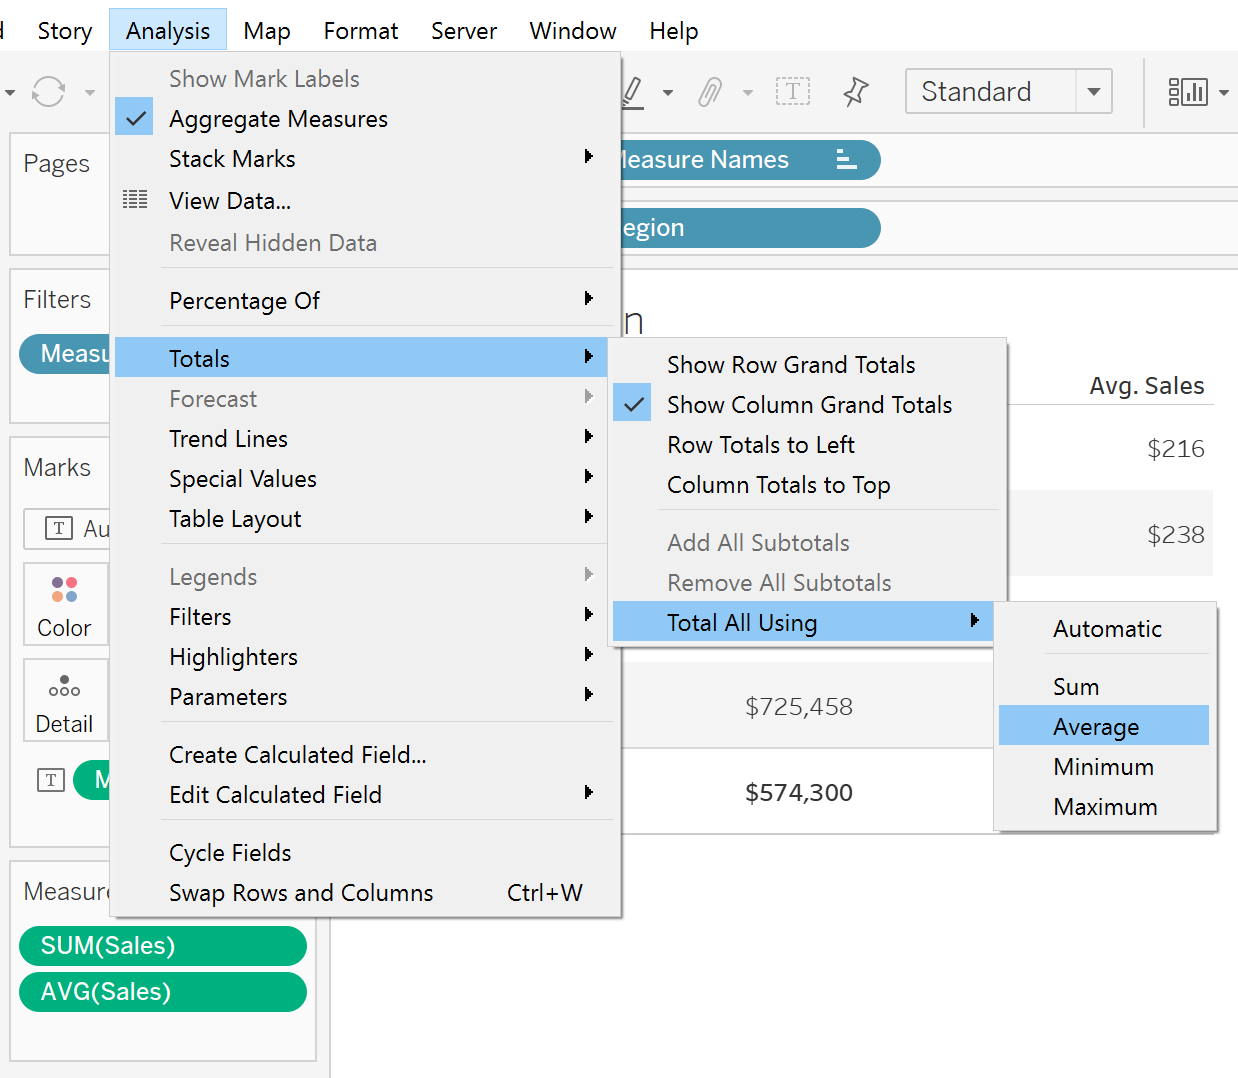
By adding AVG(Sales) to the mix we can see that the row average across all four regions is $230. However, that doesn’t tell us the overall regional average ($2.3M/4).
You could change the “Total All Using” selection to average and find out the overall regional average is $574K, but then you lose the $2.3M figure.
Here’s the trick, We’ll go back to how the worksheet was set up in the first diagram.
We’ll then create a field called Regional Sales Average.
This field summarizes the values at a region level using the FIXED function, but then applies an Average to those summarized values. We’re tricking Tableau into giving us what we want.
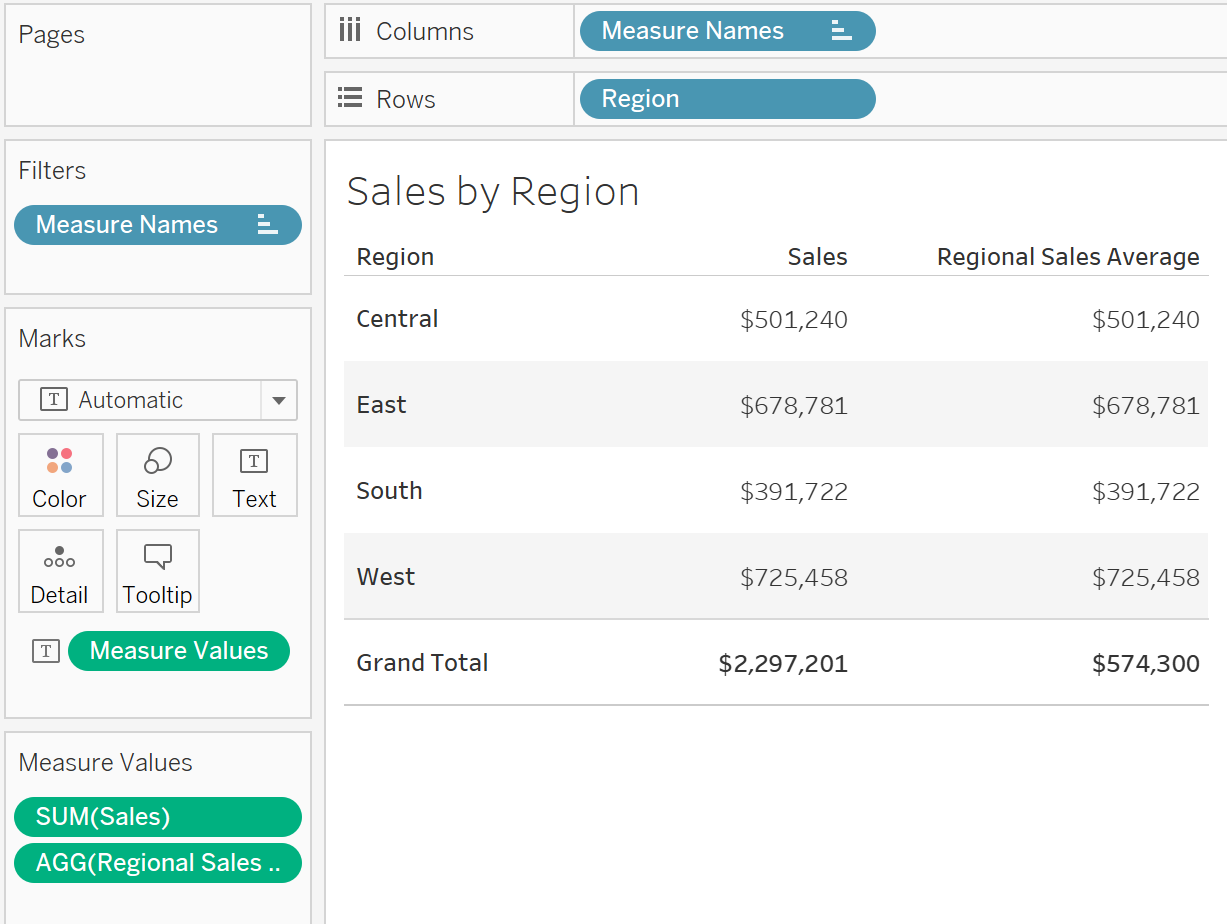
Once we drag that field onto the worksheet (and ensure “Total All Using” is reset to “Automatic”), we find that Tableau uses the default aggregations of both fields to give us the sum of the four values in the first column and the average in the second.
Need help with your own unique Tableau problem? Sign up for a Tableau Office Hour and get expert help ASAP!


