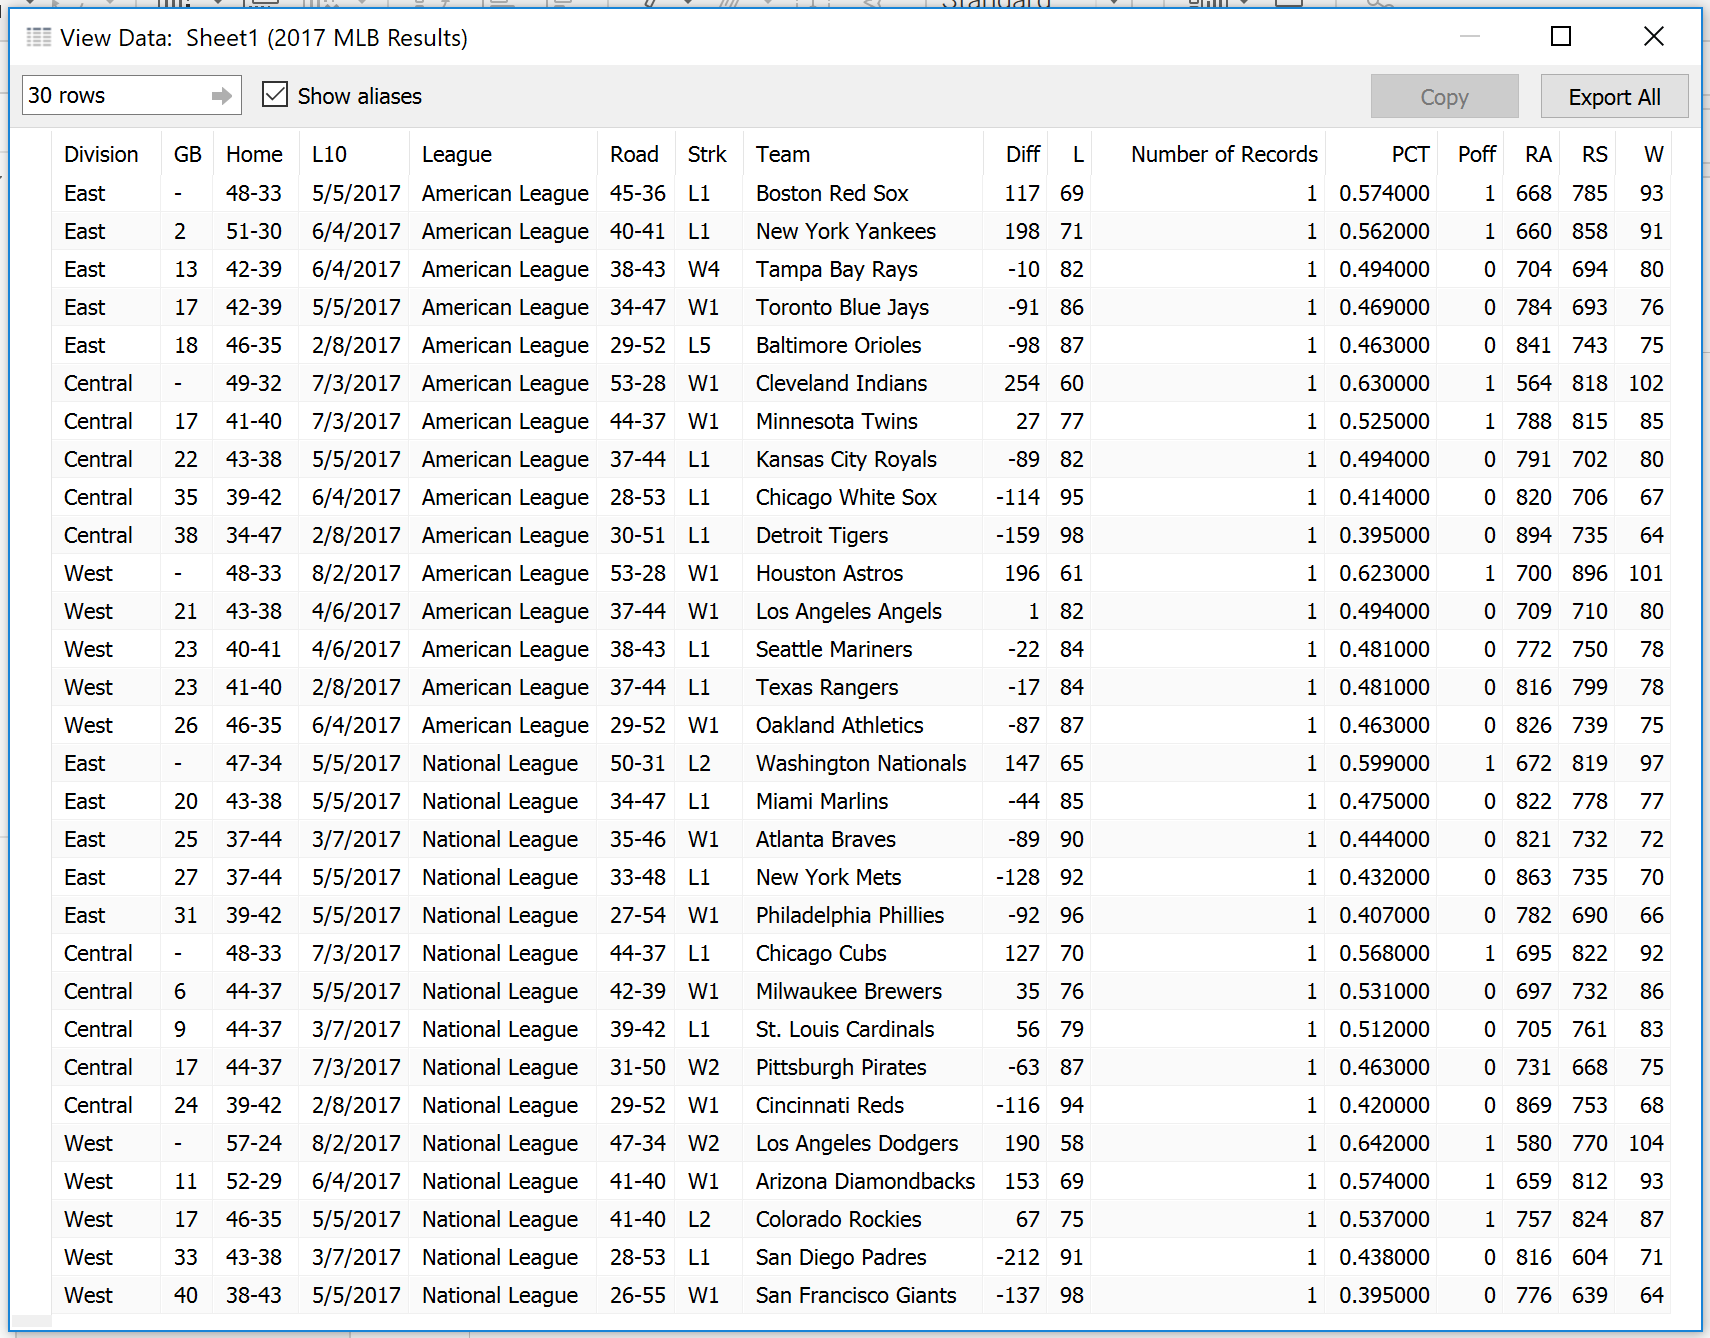
I pulled some data from ESPN on how each Major League Baseball team performed in 2017. It looks like this:
Run differential (runs scored by team - runs scored by opponents) is a strong indicator of team quality. Let’s say we pull this data into a crosstab in Tableau to see each team’s run differential compared to others in their division and league.
Since I am (unfortunately) a Mariners fan, I want to know how they rank compared to other teams in the MLB. I am going to add a table calculation to the field Diff and select the scope and direction as “Table (down)”.
Now I can see the Mariners are incredibly average with the 16th best run differential out of 30 teams.
You may have noticed that under “Compute Using” in the Table Calculation dialogue box there is a section called “Specific Dimensions” where you would normally select a scope and direction. You generally only need to use Specific Dimensions when you have 3 or more dimensions in the view. For example, let’s say you want to know how the Mariners stacked up against all teams in the American League. None of the default options calculate this. All 3 options for Pane compare a team against the other 4 teams in the league and division.
Cell just compares a team against itself. This is where we’d want to use Specific Dimensions. Notice that in this case, the Mariners rank 9/15 against all teams in the American League.
You might wonder, what does that mean when a dimension is checked or unchecked? Here’s the simple definition:
Checked: Calculate the rank across each [dimension].
Unchecked: Restart at every new [dimension].
In the example above, Tableau calculates the rank across every team and division but then restarts the rank at each new league.
Need more help? Please contact us at freesupport@onenumber.biz.


