
After scouring the internet, I couldn’t find a good reference for beginners on how to prepare your data for Tableau so I figured, it looks like I’m going to have to do this myself! This is meant to be an introductory guide only, if you have more detailed questions feel free to send me an email.
Sometimes you’ll want to use data in Tableau that you’ll export from another application. If your application exports data in a crosstab (rows and columns like Excel) format and you want to import for analysis in Tableau, it’s likely you’ll need to get it in the format Tableau prefers. This document will walk you through how to do this in Tableau.
Take this crosstab as an example:
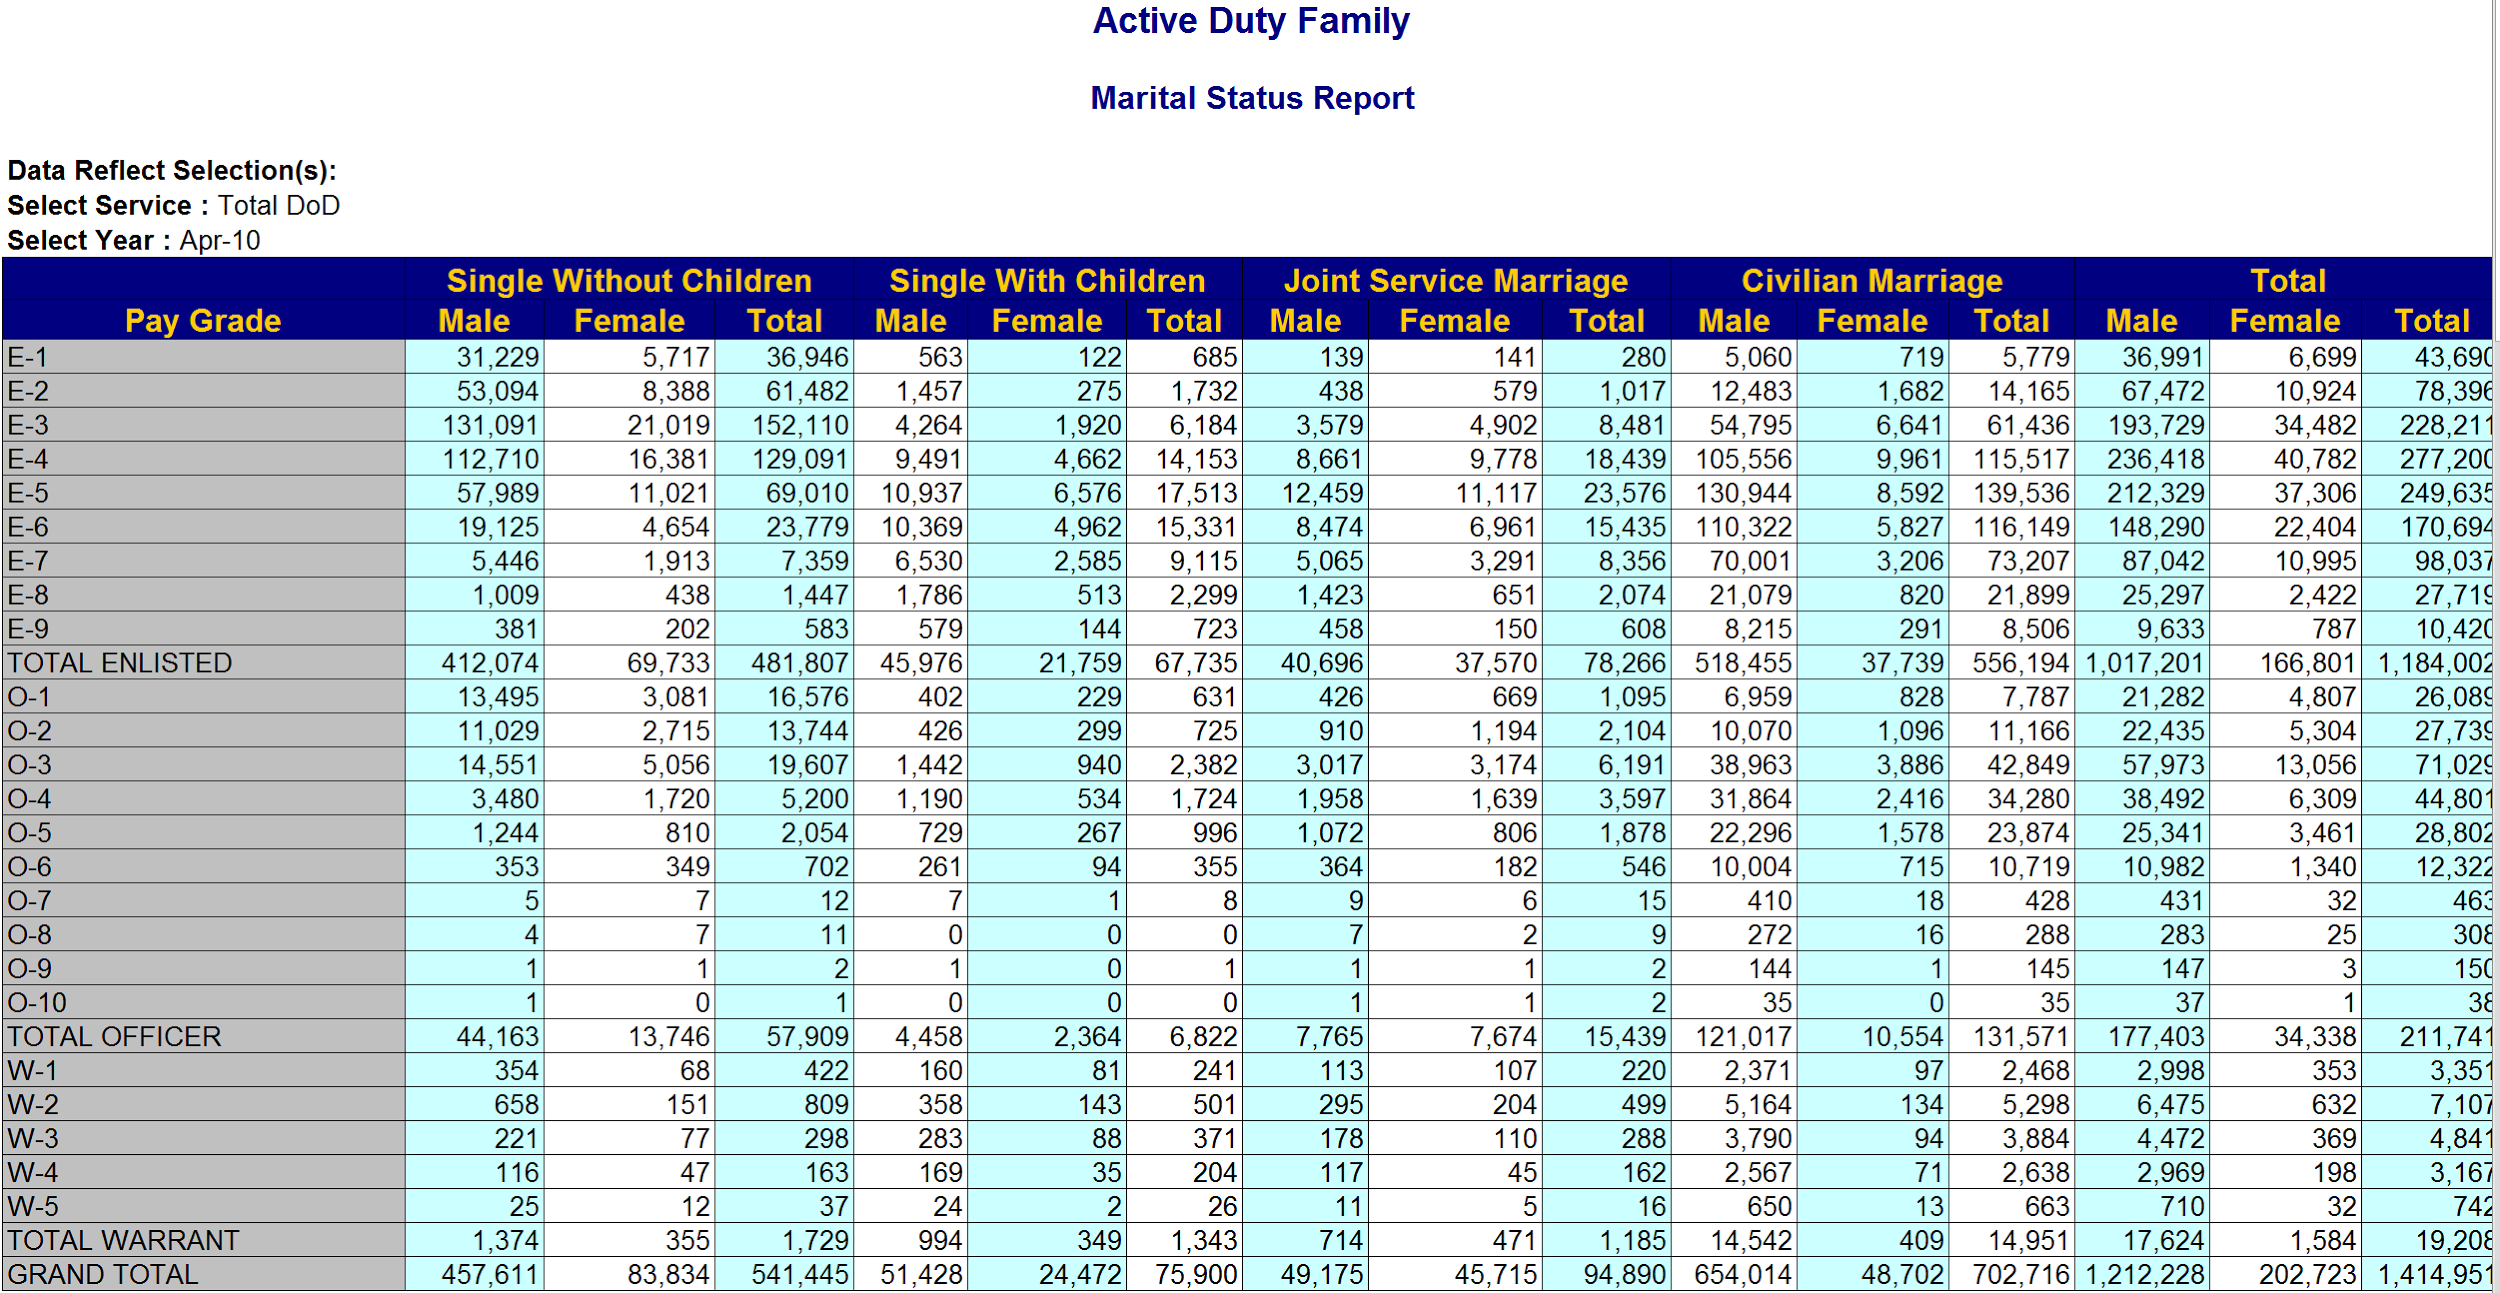
This data isn’t ready for analysis in Tableau yet. What we’d want is the end product to look something like this:

Let’s look at how you can get there using Tableau (feel free to follow along using the above link to the crosstab).
1. Connect to the Excel file and pull the “TotalDoD” sheet into the view.
2. Select the “Use Data Interpreter” button in the top-left of the worksheet to clean up the data headers. More on the data interpreter here. Notice that the headers are now cleaner, but the data is still formatted horizontally.

3. Because we only want non-totaled hide the last three columns; “Total Male”, “Total Female” and “Total Total”.

4. Select all the remaining columns except “Pay Grade” and select “Pivot” so that there is only one column for enlisted personnel.

The outcome looks like this:

5. Rename “Pivot Field Values” as “Enlisted”.
6. Apply a Custom Split to the field “Pivot Field Names” with a separator of a space and choosing the last one column to get a field which you can rename “Gender”.
7. Create a calculated field to create a “Marital Status” column. The calculation is:

8. Hide the unneeded field “Pivot Field Names”.
9. To use this data properly, make sure to add a filter to each worksheet excluding data where “Gender” is “Total” and where “Pay Grade” includes the word “Total”.
As a test, create the following worksheet and compare your output:

What if my scenario is more complicated?
The reality is that sometimes, your crosstab data is going to be even messier than that. Let’s say you needed a field in the previous scenario for “Date” that would take into account the section of the header that reads “Select Year: Apr-10”. This is not possible to do using data preparation features built into Tableau. Your best options are to either add a row of data in your excel file manually or to use a tool dedicated to data preparation (like Alteryx).
A few advantages of data preparation tools are:
● They are able to take a single cell of data (Like “Select Year”) and turn that into a new column of data.
● They can parse headers that are even messier than the above example.
● They are repeatable. If you need to prepare the same Excel file for Tableau on a weekly basis, a tool like Alteryx will save a workflow that you can run the file through again once the file is updated.
Need more help? Please contact us at freesupport@onenumber.biz.