With a range of courses from Beginner to Advanced levels, our experienced trainers can take your and your team’s Tableau skills to the next level.
Book a consulting session with a Tableau expert to help you solve a technical problem, or to set up one-on-one mentoring to help you up-skill in a particular area.
Big projects are complicated and can require a lot of time. We specialize in building efficient, intricate custom data projects to save you time and money.
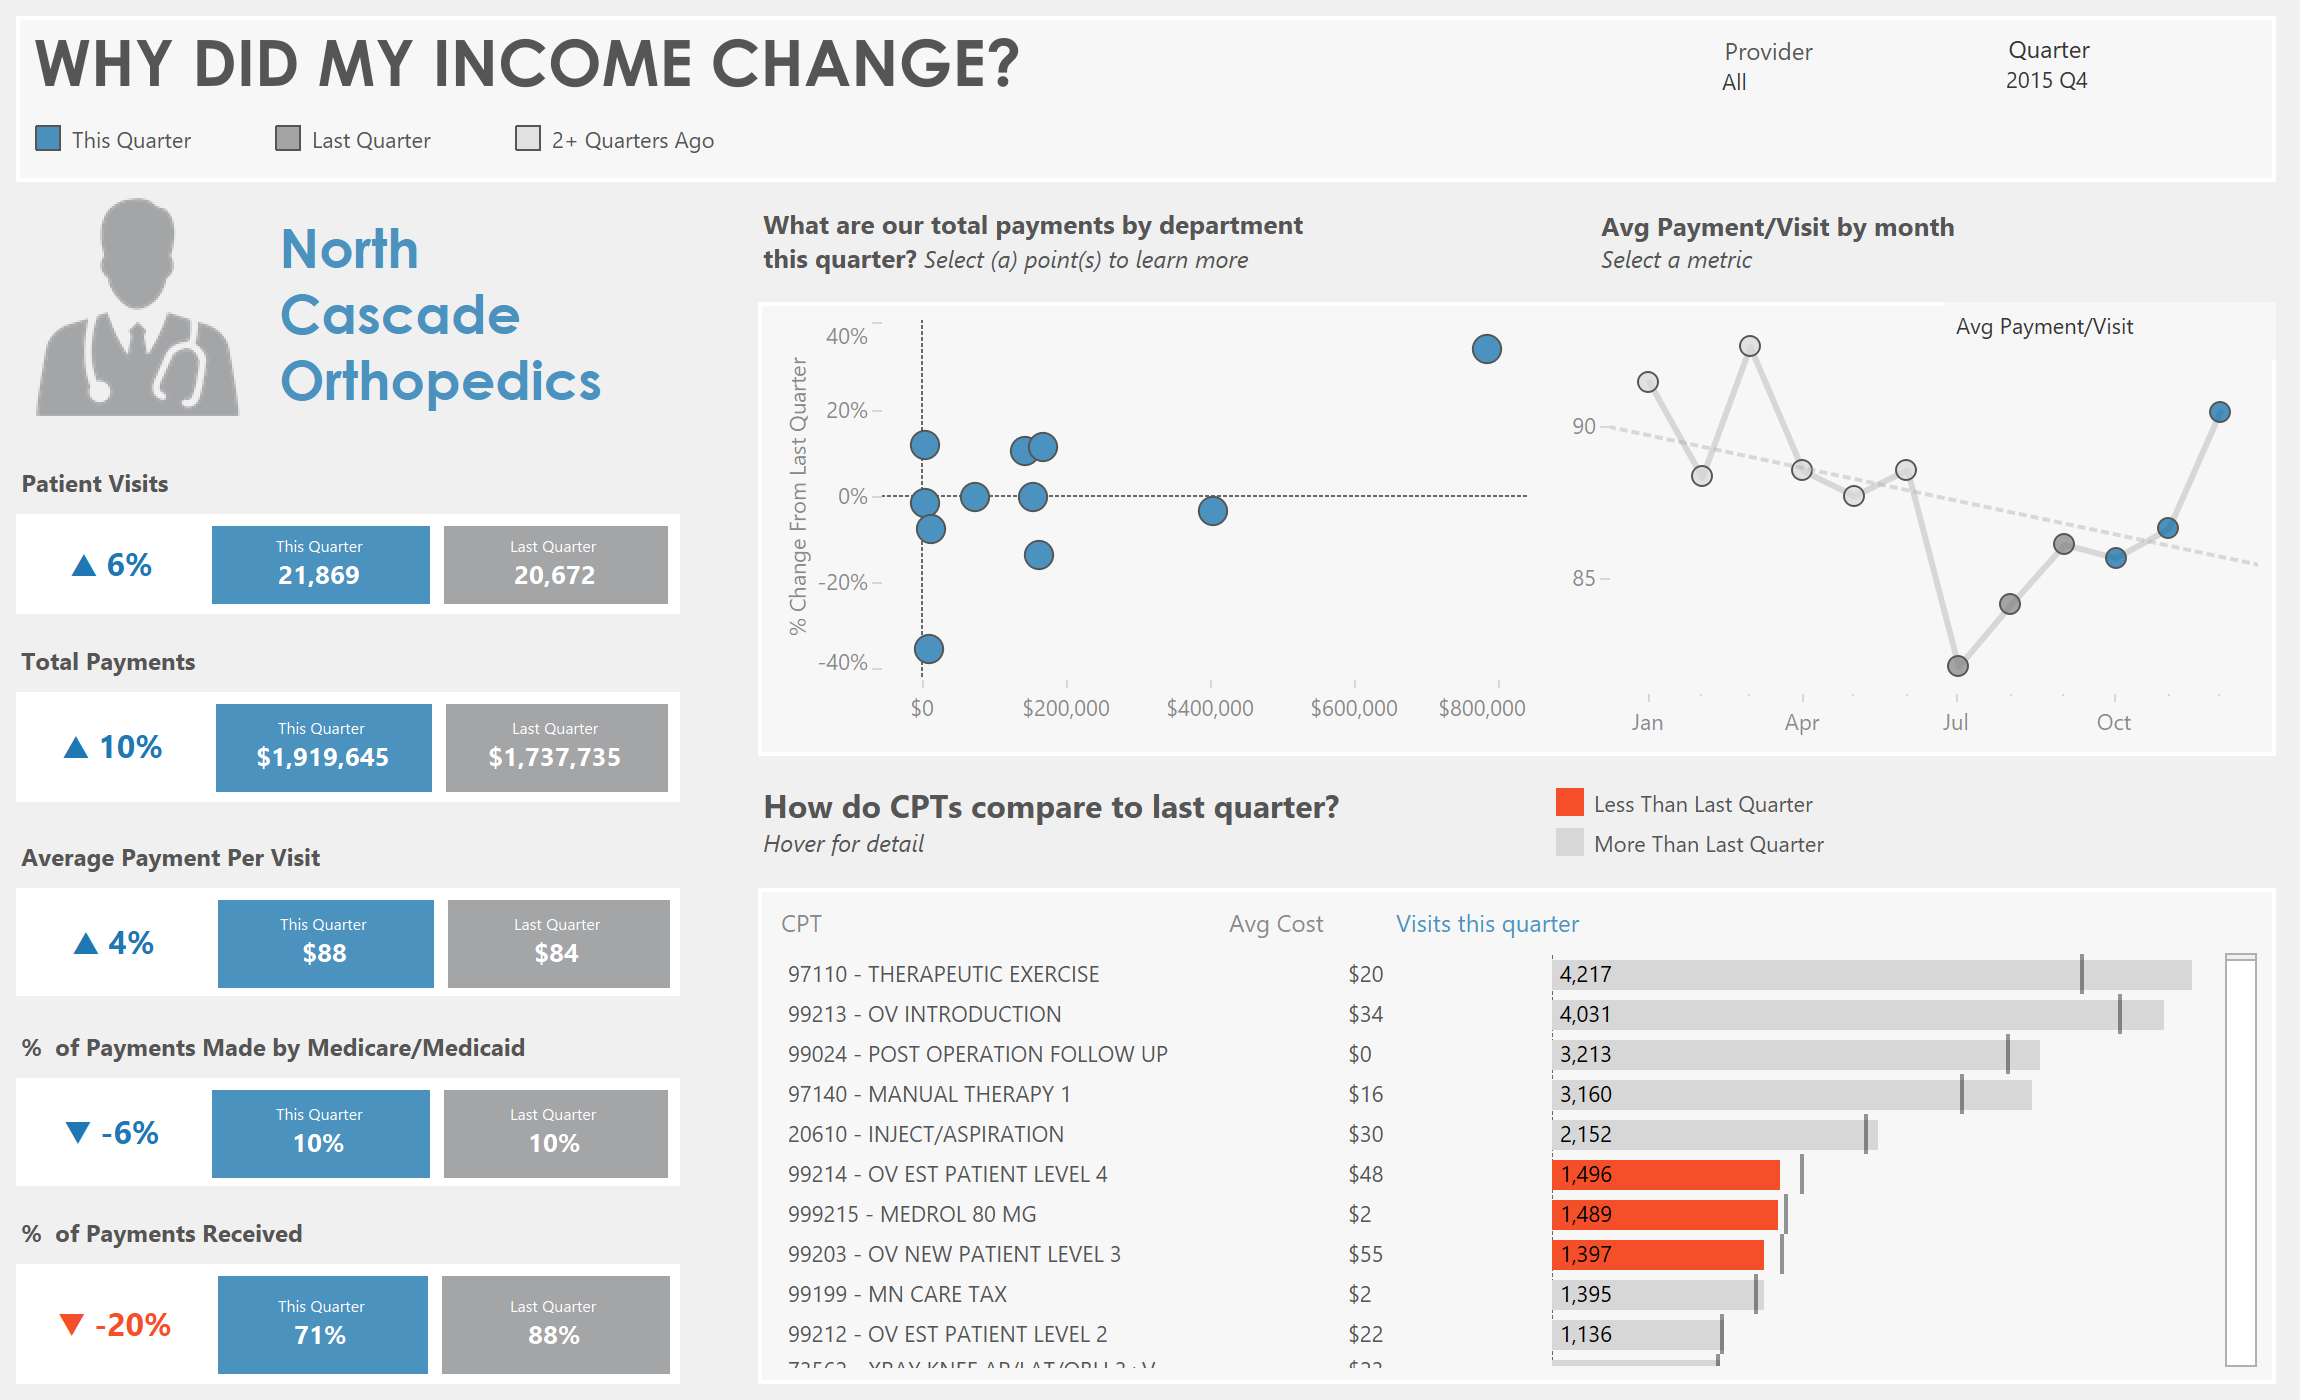
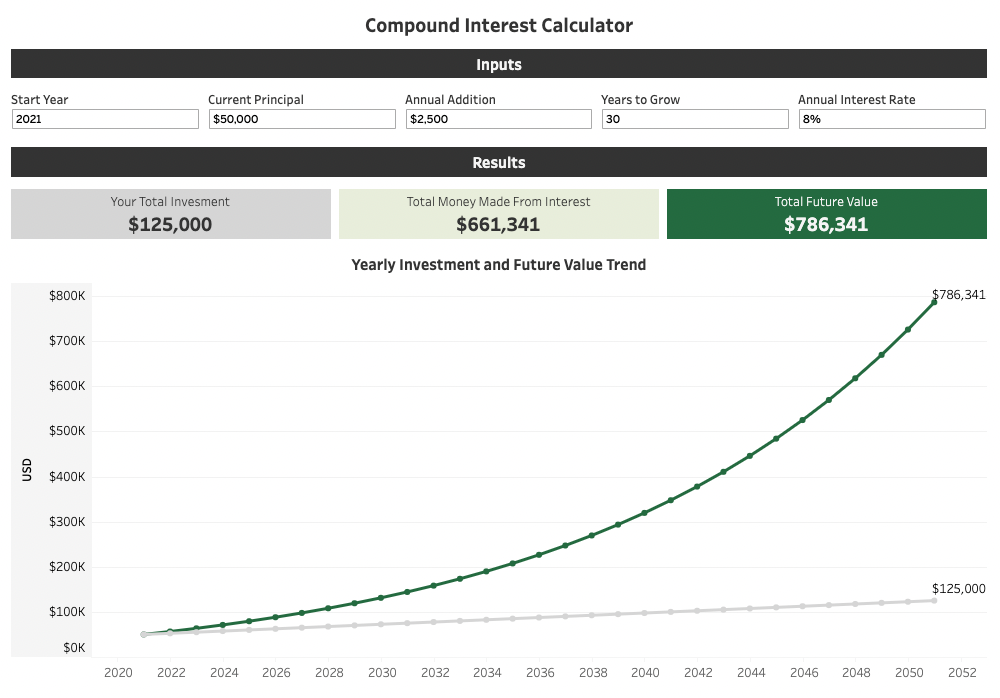
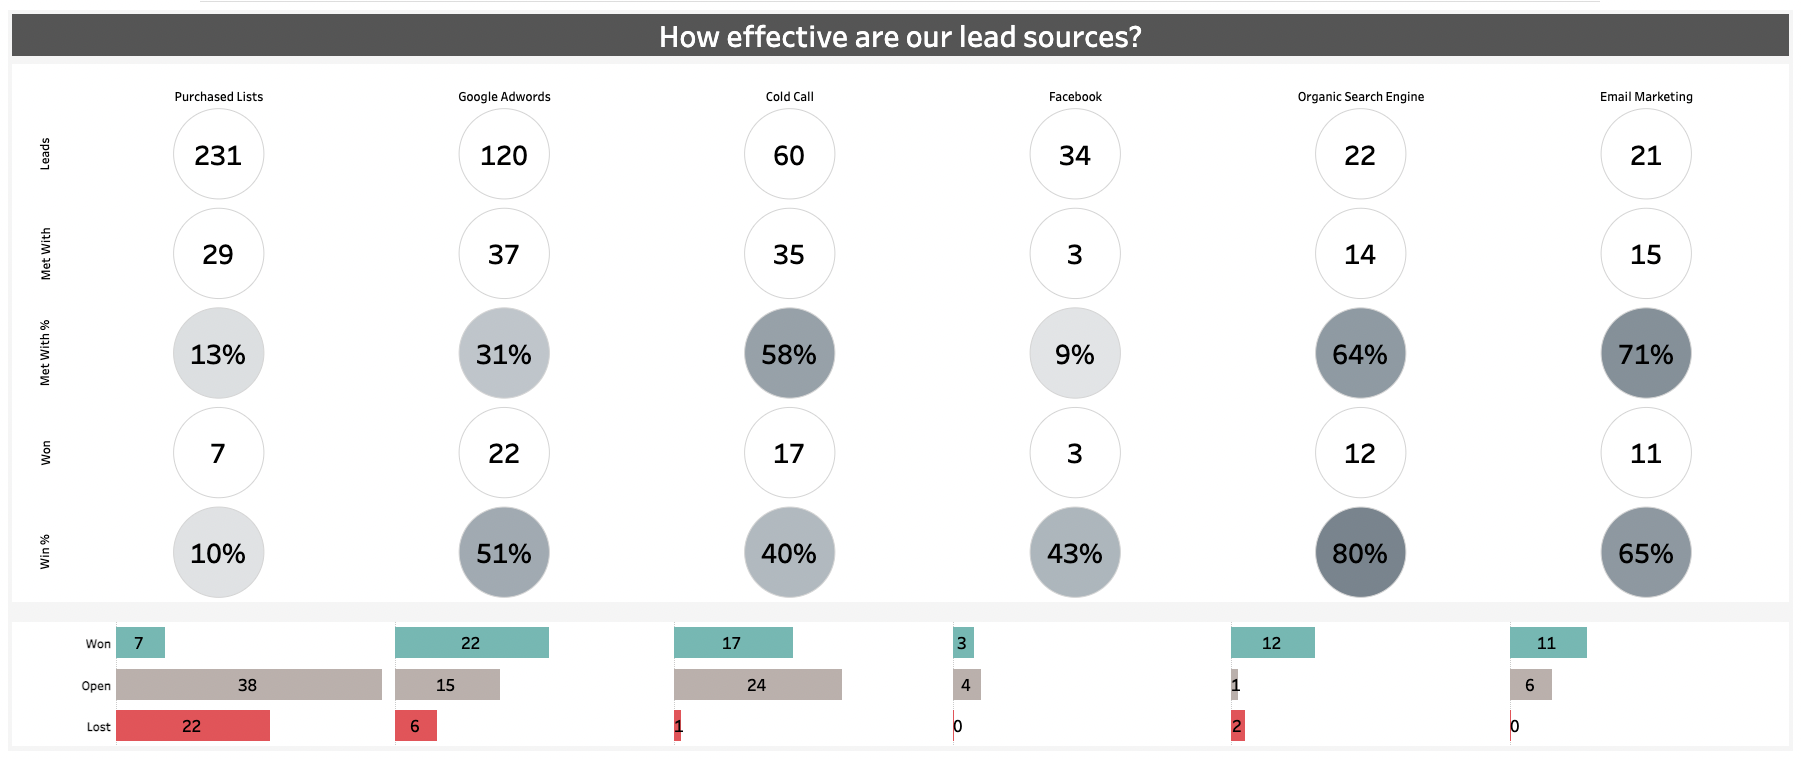
Tableau is a data visualisation and analytics platform that is comprehensive and intuitive to use. Build visually-appealing and insightful graphs and worksheets, compile them in dynamic and interactive dashboards, and share your findings with ease and security. As a market-leading business intelligence platform, Tableau lets you explore and manage your data, as well as share your insights simply with extensive privacy measures.
Who Are We?
The OneNumber team is a small, dynamic group of data professionals, with extensive experience in a range of industries. We believe in building personal relationships with our clients, and getting to know each client’s specific requirements and dreams. We are passionate about teaching and training, solving complex data problems, and about helping you get the most out of your data.
“The OneNumber team has helped us significantly advance our analytical prowess. We can’t thank them or recommend them enough!”
Our Tableau Training Passport gives you access to all our classes over a six month period for half the cost! Come to as many classes as you like, and enjoy up to 56 hours of live instruction with access to class recording for 2 weeks.
Discounted Tableau Training
All our classes, packaged into an unbeatable deal, offering you 56 hours of live instruction from our expert Tableau Instructors.
Client Satisfaction
We’ve taught hundreds of clients over the years, and built many custom technical solutions for many happy clients. Here’s what they have to say.
We want to get as much Tableau information into your hands as possible. Our team has put together a library of free resources to help you learn Tableau. From short videos and posts to answer frequently asked questions, to full-scale video series and classes, we hope that we can add value to your Tableau-learning journey!
The OneNumber Blog
Updated every week, our blog features 250+ posts about various Tableau tips, tricks, and insights to help you gain insights from your data and work with Tableau easily.
Do you want to increase the display font size of a dropdown filter in Tableau? You'd think it would be as easy as increasing the font size in the formatting window, but it isn't. Increasing the font size in the formatting window only increase the title font or the font size of a list, but not the font size of a current selection in the dropdown.
If you want to learn a workaround which allows you to customize the display font size (and also customize what text display when multiple or all values are selected), check out this video!
The visual look and feel of our dashboards make a huge impact to our end-users, and can increase the adoption rate of dashboards, particularly by non-technical users. We can't under-estimate the "wow-factor" of a good-looking dashboard!
But how do you begin to build a good looking dashboard when you're sitting with one that looks like an out-of-the-box Tableau dashboard? The answer is to craft your own design style using best practices and inspiration from others.
Hierarchies are a simple Tableau tool that allows us to drill through dimension levels, from least specific to most specific. Hierarchies typically work best when our dimensional data is organized in levels, like location (State, City, Address), or person (Office, Department, Team, Individual).
However, hierarchies can be limited. The interface to find the drill-down button is not obvious to our end-users, and drilling down from level 1 to level 4 can be cumbersome. In this video, we'll not only look at how to build and use hierarchies, but work through one or two tips on how to create optimized functionality for some selective features of hierarchies, giving you a better overall end-user experience.
📊 There will never be a better time to learn Power BI! If you come from a Tableau background and want to understand the core skills you need to successfully build data models and reports in Power BI, this one is for you!
We cover how to transform data in Power Query, model data in Power BI, build and customize visuals, and how to format a report!
Whether you want to prioritize your personal skills development or your organization is making the jump from Tableau to Power BI, start here to build a solid foundation for future Power BI success!
Dumbbell charts are an eye-catching way of comparing two values. They can be used for detailed comparisons or simple KPIs. Dumbbell charts are are effective at displaying the relationship between two data points and highlighting the magnitude of change between them. By using a simple yet powerful visual representation, dumbbell charts enable you to easily compare and contrast data points, identify trends, and uncover insights that might be hidden in traditional visualizations.
One of the biggest gripes about Tableau Prep is that it isn't as fast as people want. However, most people aren't leveraging the best way to improve performance; input filters!
Input filters allow you to filter the data at input ensuring that unneeded data is never loaded into and processed in Tableau Prep. This can lead to massive performance benefits.
Ready to learn how to apply input filters and numerous ways they can be configured? Check out this video!
Do you feel stuck when working with bar charts? How do you take them from the standard (although a bit boring) chart we all know to something powerful, engaging, and compelling?
We've put together a free webinar on our 12 top tips to taking your bar charts to the next level.
We looked at things like:
•Color-changing labels
•Multi-axis bar charts
•Multiple labels on a bar
•Drilldowns
Do you want a warning message to pop up in Tableau when there is no data or a user makes an invalid selection? Look no further, we've got the solution for you!
We've worked with numerous clients to help them apply their own version of this method to their dashboards. Ultimately, it comes down to creating a warning message sheet, putting it in a vertical layout container with the worksheet it will replace when activated, and applying some logic and customizations to the warning sheet so it only shows up when you want it to.
Ready to add dashboard warning messages to your Tableau toolkit? Check out this video!
If you're looking to turn your static Tableau dashboards into interactive powerhouses, buttons are a fantastic way to do that! In today's tutorial, we're diving into one of Tableau's most underutilised secrets: using buttons to control parameters. This isn't just about making dashboards look sleek (though they absolutely will), it's about creating an experience so intuitive that your users will actually want to explore your data.
Our YouTube channel is full of short trouble-shooting videos, deep-dives into various topics, and full-length webinars and workshops on Tableau topics. We release multiple videos a week, aiming to answer your Tableau-related questions and give you tips and tricks that might take months to learn!