
By: Eric Parker

Eric Parker lives in Seattle and has been teaching Tableau and Alteryx since 2014. He's helped thousands of students solve their most pressing problems. If you have a question, feel free to reach out to him directly via email.
One of the exercises I’ve been facilitating in my Tableau classes lately is asking students, “What is something of personal interest you’d like to visualize?”. That open-ended question leads to interesting ideas around entertainment, sports and finances to name a few common themes.
I’ve also been trying to answer that question during class myself and, time-willing, build the visuals I bring up during the discussion. Sometimes that requires utilizing public information. When I start looking for specific public data, I start with a Google search. For instance I searched for “Washington State School District Shapefile” and utilized the result in a visual last year. A number of government entities have their own websites with public information as well. One helpful, aggregated site that you might check out is Data.gov.
If those general search methods fail, I start reaching out to individuals who work for government offices. You would be surprised at how quickly they respond and how helpful they are! For instance, in the last year I’ve gotten help from…
● The City of Seattle to connect to building permit data
● Island County for connecting to property shapefiles and historical data
● King County on historical water levels of major lakes
That last point is what I want to share about today. I was curious to know when lakes are at their lowest water levels. I remember visiting Beaver Lake (Sammamish) in December years ago and seeing the water level at the lowest I had ever seen it. I assumed the water would be higher in the winter.
After failing to find the data I was searching for, I sent a few emails and was put in touch with some helpful folks at the King County Water and Land Resources Division. They pointed me to a website where I could download historic data for the lakes I requested (Washington, Sammamish, Pine and Beaver).
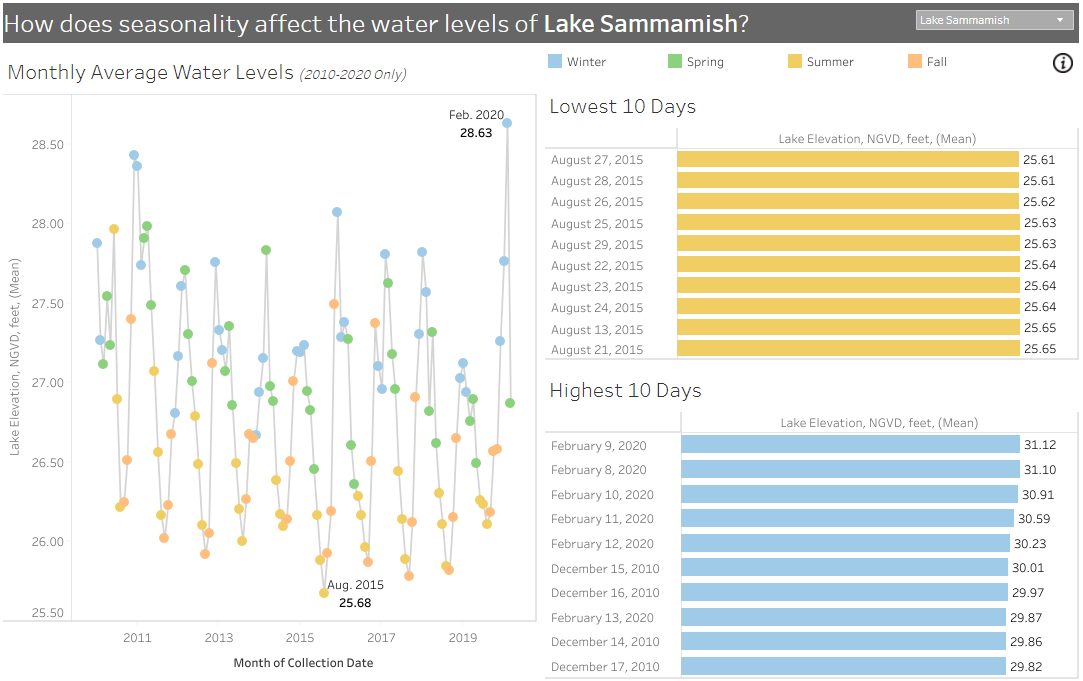
The visuals are a point-in-time proof of concept. They don’t automatically update (that would’ve taken more time and effort) but I got what I was looking for. I found out that most of these lakes bottom out in August, September or October every year which makes sense. It rains less in the summer and the snow has largely melted by that time of year.

It turns out it was helpful that I embarked on this exercise because I helped the division realize they had an error in one of their data inputs. Some of their data is hand-fed by private citizens.
My encouragement is that if you are looking to utilize public data for a project and can’t find it easily, reach out! You might be surprised how easy it is to get access to what you’re looking for and they might be happy to learn that the data collection efforts are being put to good use!
Check out more examples on my Tableau Public page! Looking for help working on your own projects? Sign up for an office hour and we can help!