
By: Eric Parker

Eric Parker lives in Seattle and has been teaching Tableau and Alteryx since 2014. He's helped thousands of students solve their most pressing problems. If you have a question, feel free to reach out to him directly via email.
On a number of occasions, I’ve been asked if Tableau can use a top filter to show the top percent of a population. For instance, some varieties of that questions has been;
● Which students have performed in the top 5%?
● Which products are in the top 1% of best sellers?
● What are our top 10% of locations by customer volume?
Using Superstore data, I built a chart showing sales by product.

Using a top filter, I can quickly limit the view to show the top 10 products.
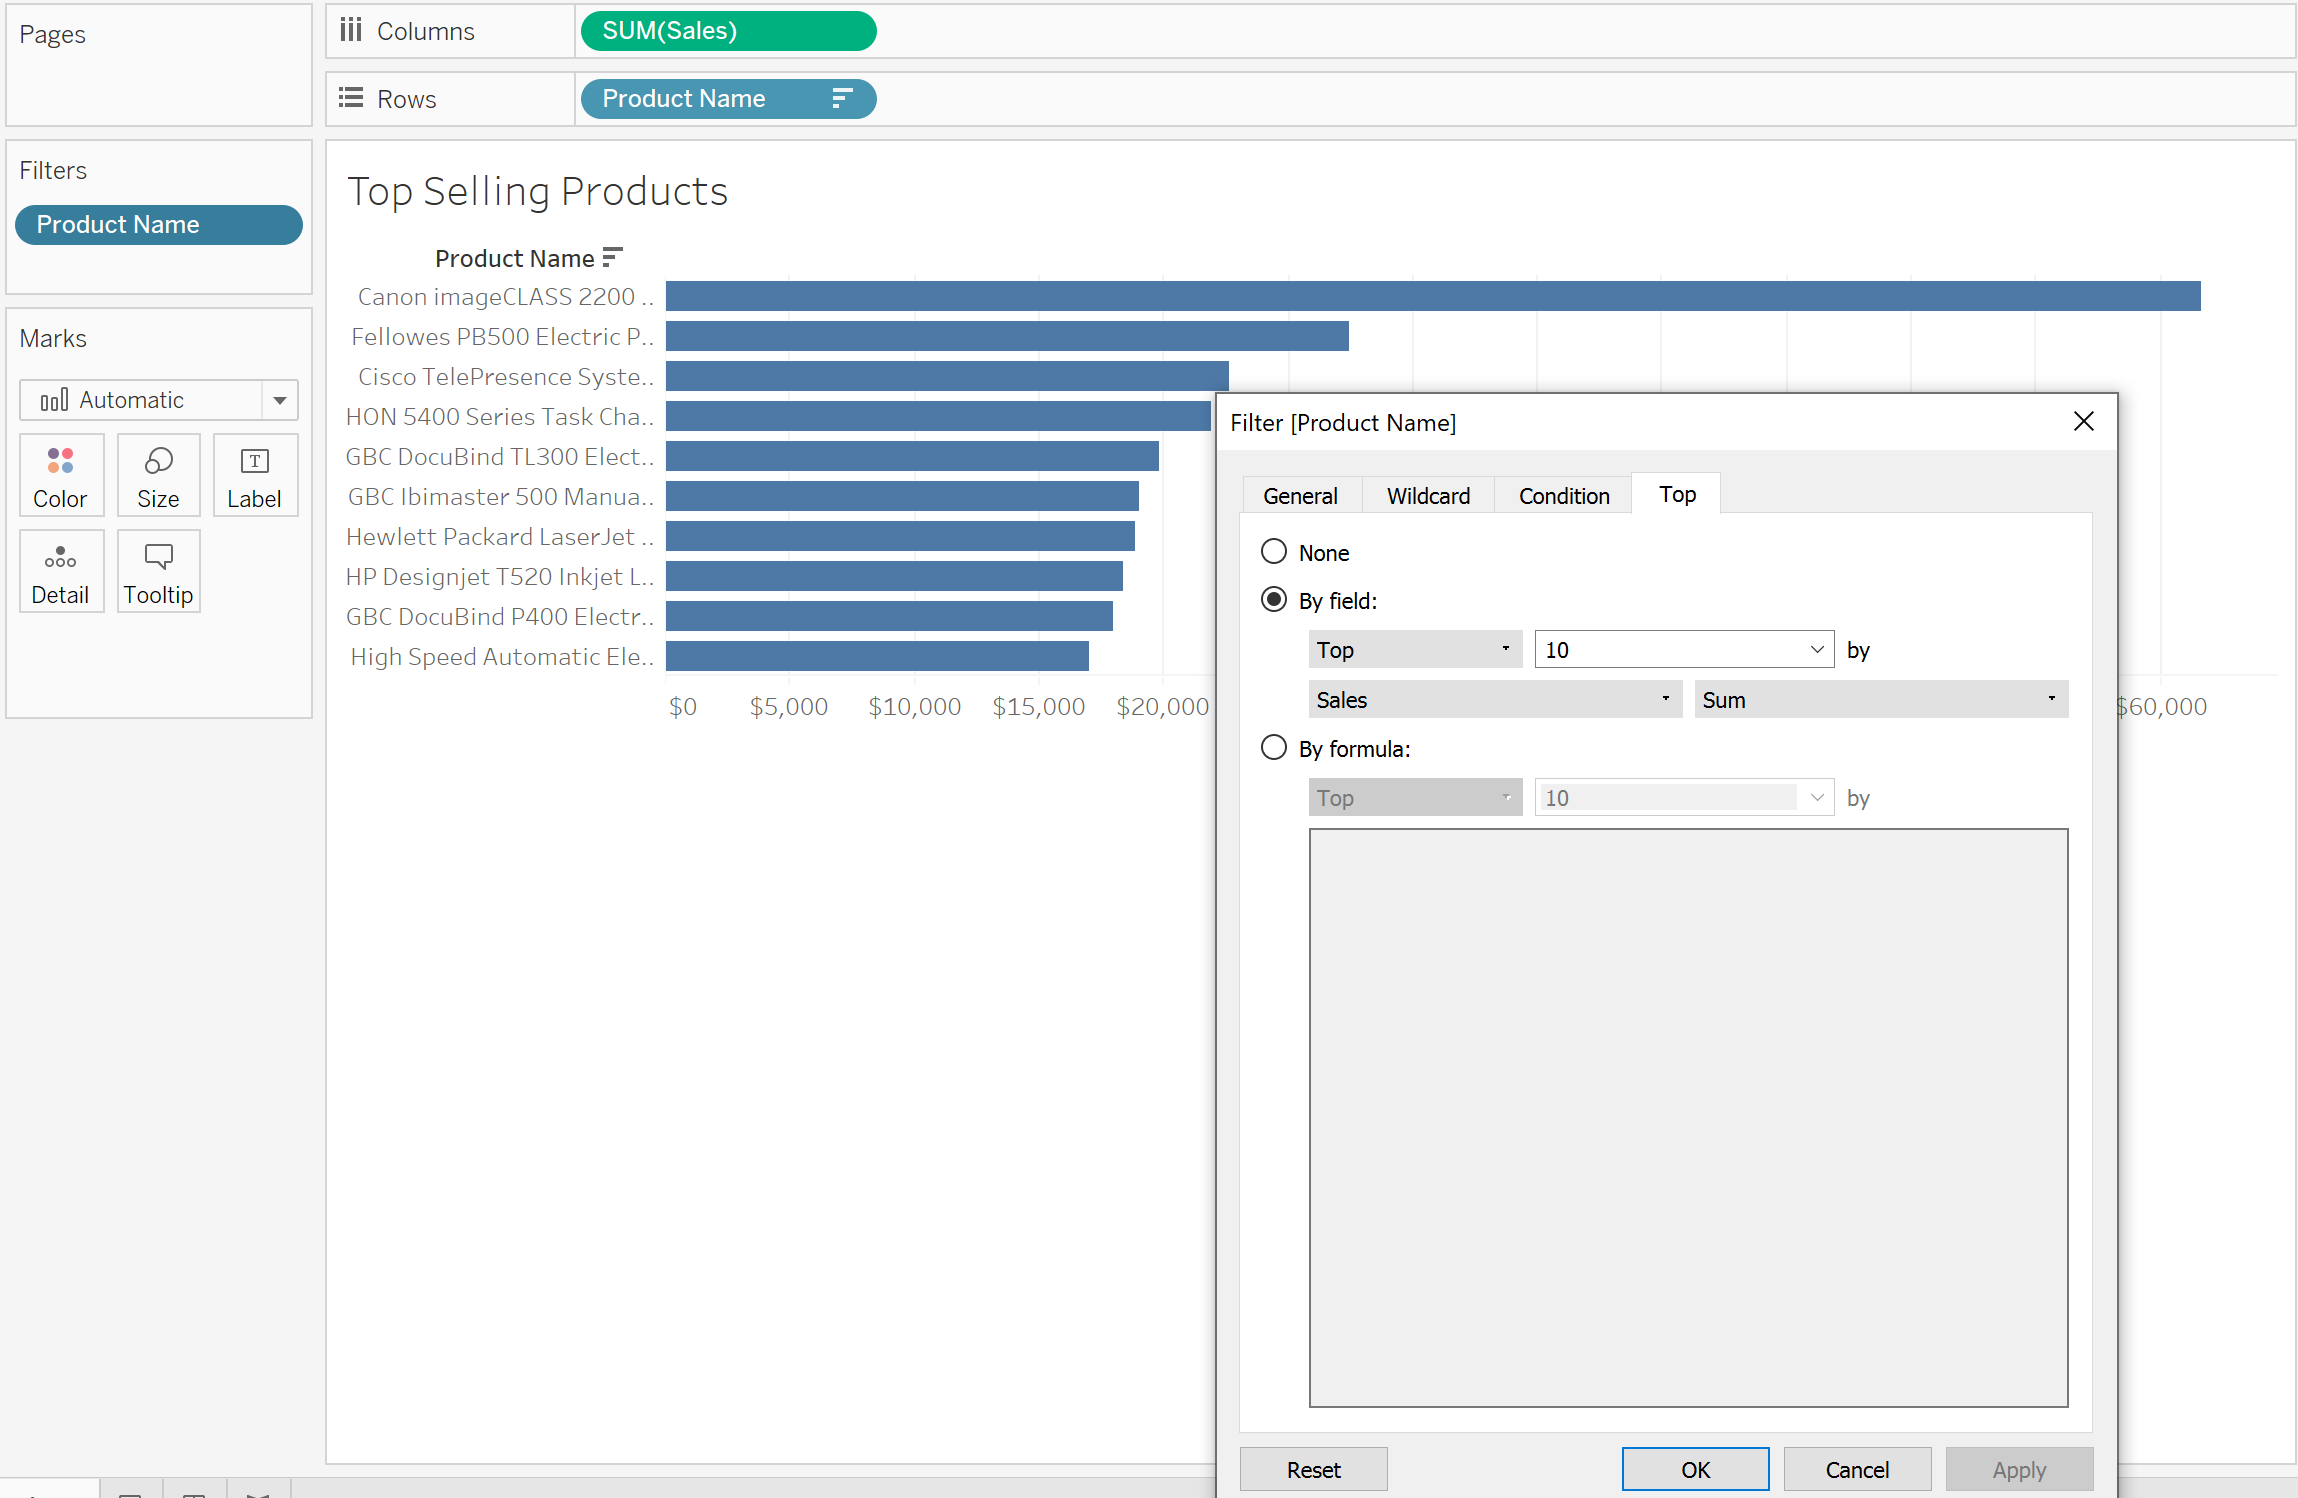
Within the “Top” section of the filter, there is no ability to choose a top percent. After some investigation, I realized the best way to set this up is with a calculation.
The key function we will use is the RANK_PERCENTILE function. Here’s what the function looks like in a calculation and how it displays on a label at the end of the bars.

You can see that the first product in this image is in the 100th percentile and the last value you can see in the screenshot is in the mid-98th percentile.
If you want a hardcoded top percent, you write it directly into the calculation and use it as a filter. For instance, to keep the top one percent, the calculation would look like this.

That calculation can be added to the Filters card and the True values can be kept to restrict the worksheet to only keep the top one percent of products.

If you’d like to make that percent dynamic, you can do so by utilizing a parameter. The parameter can be a float type parameter with values ranging from 1% - 100% (.01-1).

The parameter can be incorporated into the previous calculation like so.

The worksheet title can be customized to incorporate the parameter value so that when the parameter is updated, the title will reflect an accurate value.

Here’s a screenshot of the worksheet after the parameter was updated to 2%.

Need help building your own calculations or customizations? Reach out or book an office hour and we’ll help you get rolling!