
By: Eric Parker

Eric Parker lives in Seattle and has been teaching Tableau and Alteryx for 5 years. He's helped thousands of students solve their most pressing problems. If you have a question, feel free to reach out to him directly via email.
“How do you calculate a headcount at a moment in time when you only have a start and end date?” I’ve gotten this question several times. My answer used to be “Ideally, you’d want a row of data for an individual for every possible date unit you’d want to count them at.” For instance, if you had a company with around 500 employees and you wanted to see headcount for each month, you’d probably want around 6000 rows of data (500 x 12) per year.
This poses two problems. First, you might not have the flexibility to structure your data this way. Second, you could end up with a lot more rows of data than you want. I’m going to propose an alternate way to approach this problem.
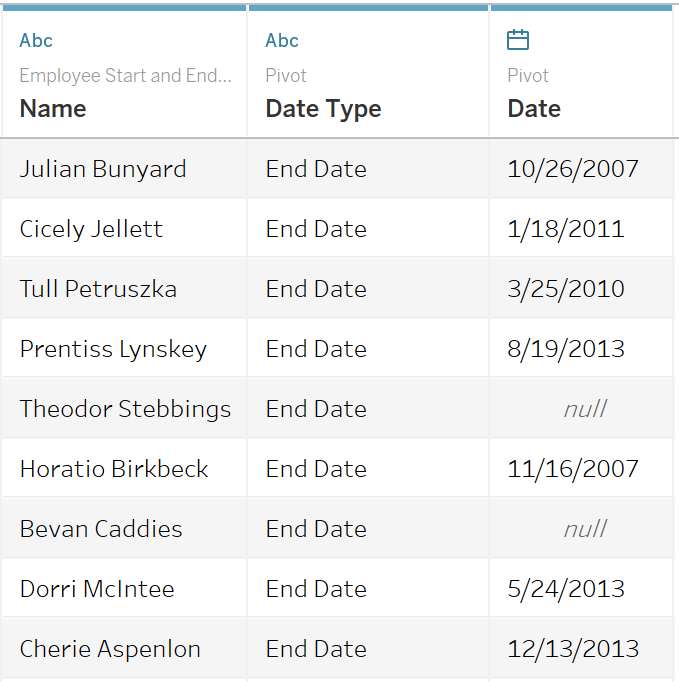
Let’s say we are trying to answer the question “How many employees were working for the company in January 2018?” We have a dataset whose format looks like this:

Anywhere you see a null End Date is an active employee.
The first step is to pull the data into Tableau and pivot the Start Date and End Date fields.

The next step is to rename the pivoted fields.
Next we need to pick an “end date” for the End Date values that are null. I’ve created a calculated field and have just chosen one month from today as my placeholder.

Now we’re going to create a calculated field that adds and subtracts headcount over time:

Then we’re going to create the bones of the visual. We’ll put the date field on Columns set to continuous month. We’ll also put the sum of headcount on Rows.

The last step (other than cosmetic improvements) is to add a running sum of total table calculation to the running headcount field.

The finished product provides a graph displaying the running sum of employees by month so you can select a single month and find out what the headcount was.

Need more help? Sign up for an office hour to gets your problems sorted today!