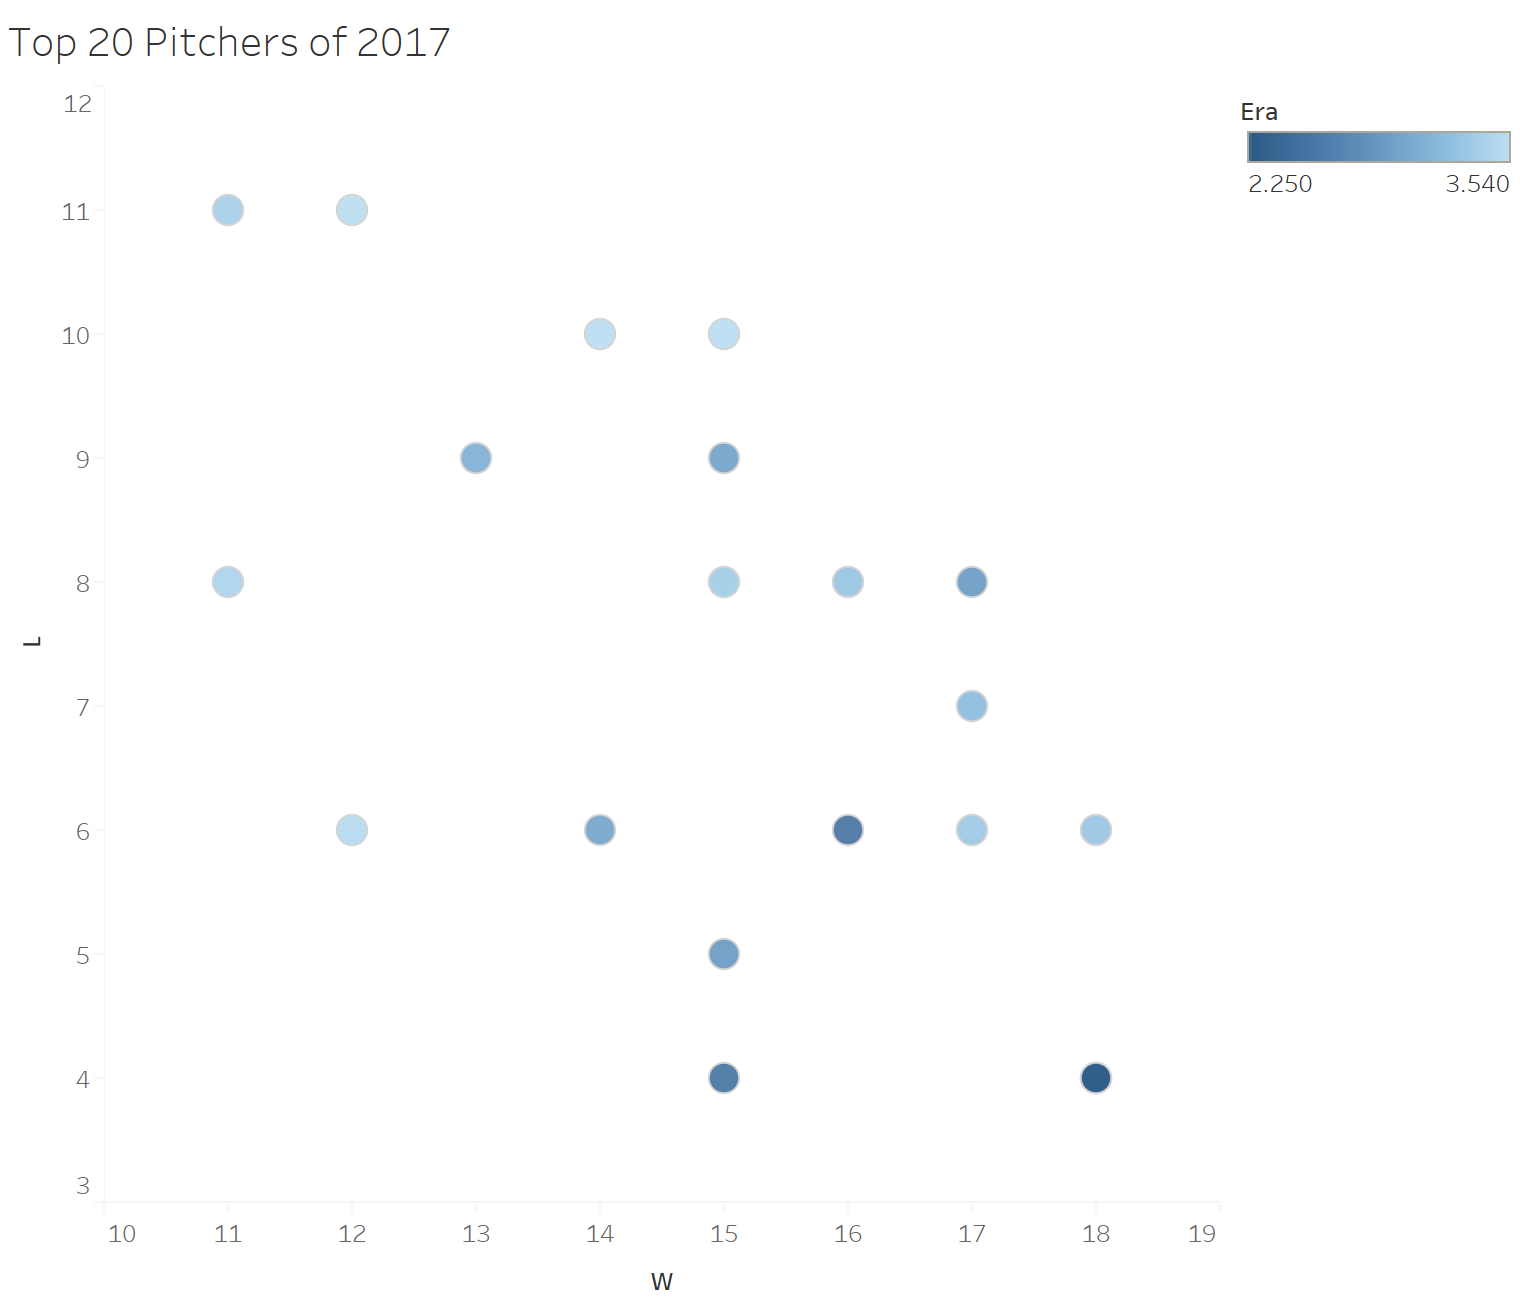
I’ve pulled a set of data for the top pitchers in Major League Baseball in 2017. Let’s say we want to do an analysis to see which of the best pitchers got extra help from their teams and which didn’t.
I’ll start by creating a scatter plot displaying wins and losses by each pitcher. Pitchers with dark blue circles that are farther toward the top did not get much run support from their teams. Pitchers with lighter circles that are closer to the bottom did.
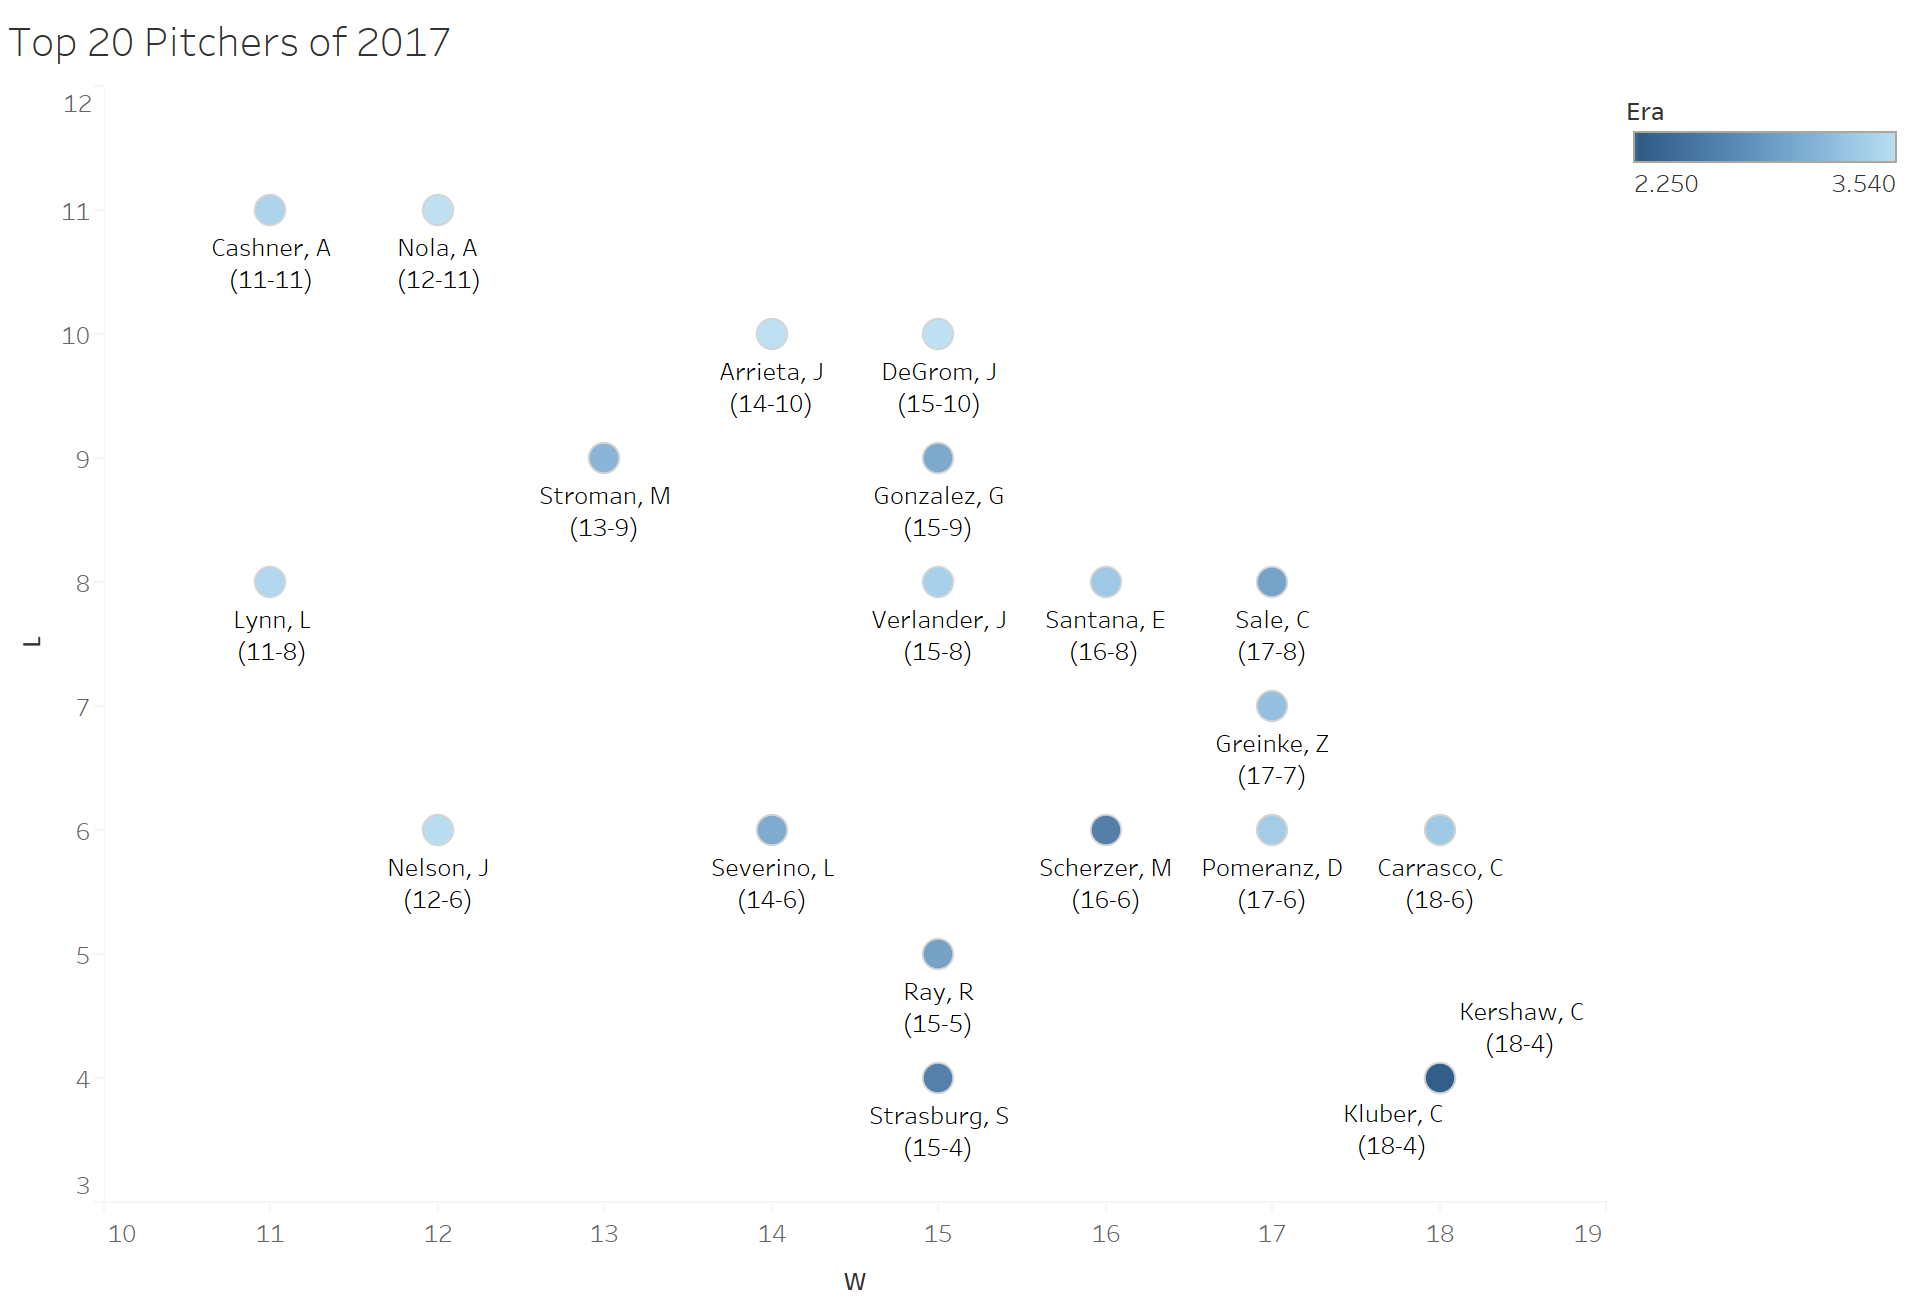
Now let’s say we want to add a label to each point displaying the player’s name and win-loss record. We would create a calculated field like this:

And then drop it on the Label tab in the Marks Card:

Notice how messy the labels are after doing this. You might think, “Maybe we can clean this up by splitting the name and record to two different lines.” Unfortunately, creating a line break in the calculated field actually doesn’t affect the label display.

This is where the function CHAR() comes in. What CHAR() does is takes a number and converts it into an ASCII character. The character 10 represents a new line feed. Watch what happens when we add this to the calculation.

Result:

The labels look much cleaner after editing the calculation and doing a small amount of manual rearranging.